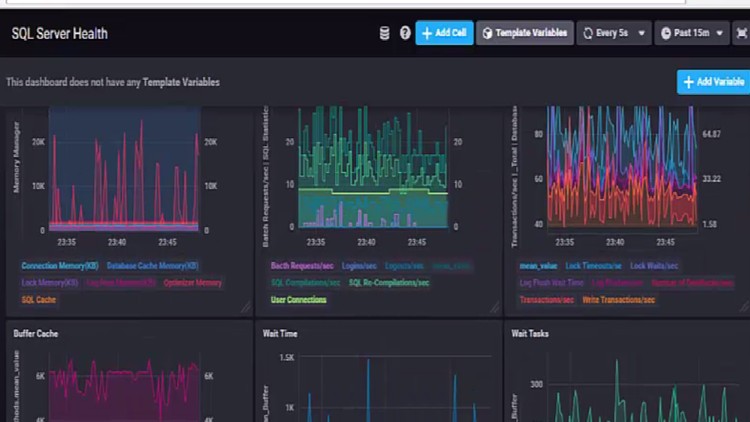
Telegraf/InfluxDB/Grafana(TICK) for Monitoring SQL Server

Why take this course?
🚀 Master SQL Server Monitoring with TICK Stack: Telegraf, InfluxDB, Chronograf & Kapacitor!
🎉 Course Headline: Learn how to build a dashboard to monitor SQL Server and other critical systems using the powerful TICK stack (Telegraf, InfluxDB, Chronograf, and Kapacitor).
🌍 About the Course: Are you looking to efficiently store and monitor your server or application metrics for performance insights? Whether you're a beginner or seasoned professional, this comprehensive online course is designed to teach you everything you need to know about using the TICK stack for monitoring your SQL Server. This open-source suite is renowned for its robustness and support, allowing you to collect data from over 200+ popular services, applications, and servers.
🔍 What You'll Learn:
- Understanding Telegraf: Learn how this agent collects metrics from your SQL Server and other systems.
- InfluxDB Mastery: Discover how to store the collected data efficiently and reliably.
- Chronograf & Kapacitor Deep Dive: Explore the power of visualizing and alerting based on the collected data.
- Building a SQL Server Monitoring Dashboard: Follow step-by-step instructions to create a dashboard that keeps track of your SQL Database server metrics.
🛠️ Who Is This Course For? This course is perfect for:
- Developers and DevOps engineers responsible for monitoring systems.
- System administrators who want to keep an eye on their critical applications.
- Database administrators looking to monitor SQL Server performance.
- Anyone interested in learning about real-time data collection, storage, and visualization with the TICK stack.
📚 Course Structure:
- Introduction to TICK Stack: An overview of what each component does and how they fit together.
- Setting Up Your Environment: Step-by-step instructions on installing and configuring Telegraf, InfluxDB, Chronograf, and Kapacitor.
- Collecting Metrics with Telegraf: Learn how to use Telegraf to collect data from your SQL Server and other sources.
- Data Storage with InfluxDB: Understand how to store the collected metrics and manage your database.
- Exploring Chronograf & Kapacitor: Discover how to create dashboards and set up alerting rules for real-time monitoring.
- Practical Exercise: Apply your knowledge by setting up a full monitoring system for your SQL Server.
- Real-World Applications: Learn how to adapt the TICK stack for different scenarios, including other systems beyond SQL Server.
🎓 Why Take This Course?
- Easy-to-Follow Content: Clear explanations for all concepts, making it accessible no matter your technical background.
- Practical Skills: Hands-on experience to ensure you can confidently implement what you learn.
- Versatile Application: Learn a skill set applicable across various technologies and industries.
- Add Value to Your Resume: Stand out in the job market with this sought-after skill set.
📅 Get Started Today! Embark on your monitoring journey and transform the way you handle system performance. Sign up for this course and take the first step towards mastering the TICK stack for SQL Server monitoring! 🌟
Enroll now and become a monitoring expert with the TICK stack! 👇
Loading charts...