Tableau A-Z: Hands-On Tableau Training for Data Science

Why take this course?
🚀 Tableau A-Z: Hands-On Tableau Training for Data Science 📊
Embark on a comprehensive journey through the world of data visualization and analytics with our "Tableau A-Z" course. This is your opportunity to harness the power of Tableau, a leading data visualization tool, to uncover valuable insights from complex datasets in fields like sales trends, customer purchase behavior, or production processes. 🎓
Why Choose This Course?
✅ Practical Approach: Dive into real-world data analytics exercises and quizzes that emphasize hands-on learning. With Kirill Eremenko as your instructor, you're in expert hands!
✅ Real-World Applications: Learn to analyze and visualize data so you can make informed decisions and respond effectively to trends and patterns.
✅ Step-by-Step Learning: Whether you're a beginner or an advanced user, this course is structured so you can start wherever you feel most comfortable and progress at your own pace.
Course Highlights:
🔗 Connect and Combine Data: Master the art of connecting Tableau to various datasets, learning how to blend and join data from multiple sources to create comprehensive reports.
- Connect Tableau to a Variety of Datasets 🗂️
- Analyze, Blend, Join, and Calculate Data 📈
📈 Visualize Your Data: Convert raw data into engaging visualizations that tell compelling stories with the help of Tableau's powerful features.
- Visualize Data in Charts, Plots, Maps, and Interactive Dashboards 🌱
- Use Aggregations to Summarize Information 📊
- Ensure Accurate Calculations with Granularity 🔍
🧠 Mastering Advanced Features: Explore the latest features of Tableau, including table calculations, treemap charts, and storylines, as well as table calculations in Tableau 10.
- Create Complex Visualizations like Scatterplots & Storylines 🌍
- Dive into Advanced Data Preparation Techniques 🛠️
Course Structure:
- Tableau Basics: Navigate the software, connect to a data file, and export a worksheet – all tailored for beginners to quickly feel comfortable.
- Working with Data Extracts & Time Series: Discover how to find trends and make accurate forecasts within your datasets.
- Data Summarization: Learn to use aggregations and granularity to make data easier to understand.
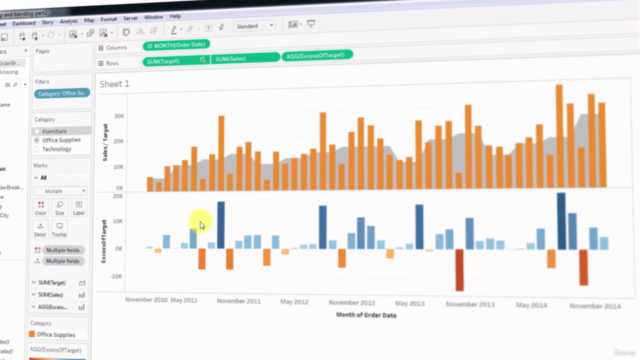
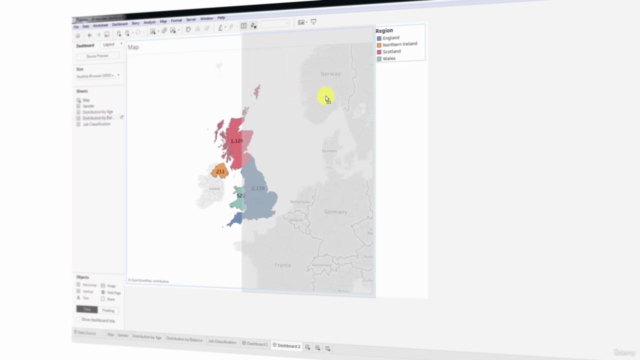
- Creating Visualizations: From charts to maps, learn how to visualize your data effectively and create interactive dashboards.
- Joining & Blending Data: Understand the best practices for joining or blending data from multiple sources for a holistic view of the information.
- Advanced Data Preparation: Utilize table calculations, treemap charts, and storylines in your visualizations.
- Stay Updated: The course content is regularly updated to keep you ahead of the curve with the latest features of Tableau.
What You'll Gain:
🎯 Become a highly proficient Tableau user 🚀 Extract knowledge and insights from complex data sets 📈 Analyze and visualize data for any purpose, from scientific data to buying trends 🎉 Use your new skills to make a significant impact in data science
By the end of this course, you'll have mastered Tableau and will be able to analyze and visualize data with confidence and precision. Whether you're looking to advance your career or start a new one as a data scientist, this course is your gateway to unlocking the full potential of your data. 💻✨
Enroll now and transform your data into actionable insights with Tableau! 🚀📊🎉
Course Gallery


Loading charts...
Comidoc Review
Our Verdict
Rated 4.62 out of 5 with over 400,000 subscribers, this hands-on Tableau course teaches data science step by step. It caters well to beginners, offering a solid understanding of the fundamentals and various types of charts. Although some areas lack clear instructions or challenge you enough to become a certified professional, the engaging teaching style, updated content, and valuable real-life examples make this course an excellent starting point for diving into data visualization.
What We Liked
- Covers all the basics of Tableau in a no-nonsense, effective manner with clear explanations and engaging teaching style.
- Hands-on exercises and real-world examples provide valuable practical experience for data visualization beginners.
- Organic and well-explained lessons allow learners to grasp complex topics easily, making them feel capable of becoming technical data analysts.
- Updated course content with the latest Tableau features ensures students stay current on data preparation techniques.
Potential Drawbacks
- Section 9 might be unclear for some students as it lacks detailed explanations compared to other sections.
- Case studies and challenges are missing from most sections, which would help learners understand the final goal in creating visualizations.
- A few lessons show actions too quickly for learners to fully comprehend particular selections in certain exercises.