Excel Power Query, Power Pivot, DAX, Power BI & Power 3D Map

Why take this course?
🚀 [Course Title] Learn Excel Power Query, Power Pivot, DAX, Power BI Tools, and 3D Maps. Build Excel Data Analyst Models with Excel 365 🚀
🌟 COMPLETELY REDONE ON 2023 WITH NEW VIDEOS! 🌟
✨ Transform into an Excel Star with Advanced Business Intelligence Tools! ✨
🛠️ IMPORTANT NOTE: Ensure Your Excel Version is Compatible Before You Enroll!
- Watch the 3rd lecture on Versions, Compatibility, and Installation of Power Pivot & Power Map (available with a free preview).
- Remember that Power Pivot is currently only available for specific versions of Excel for Windows, not on Mac.
🚀 Content and Overview 🠤 This course serves as a comprehensive guide, offering simple step-by-step instructions to create business intelligence reports and dashboards in Excel efficiently. Designed for Microsoft Excel 2019 and Microsoft 365, it's also compatible with older versions.
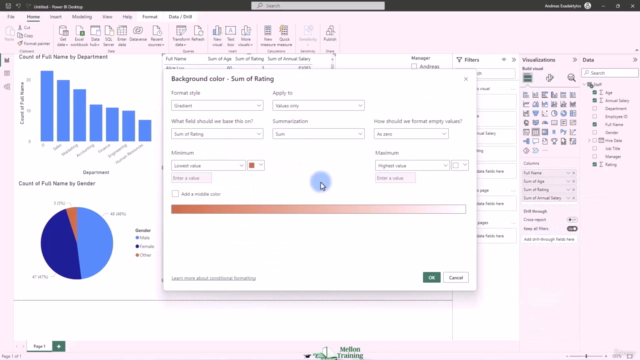
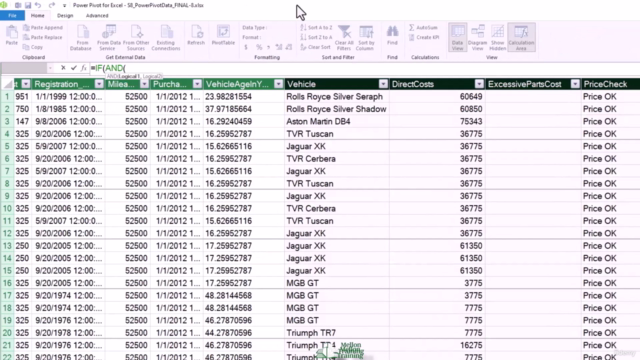
🧠 Aiming to Introduce the Excel User to Self-Service BI... We will leverage Microsoft Excel Power Query, Power Pivot, Power BI, Power 3D Maps tools, and DAX Formula Language to analyze large datasets quickly and transform them into actionable insights – without any programming!
📊 Master Power BI Desktop and Create a Stunning Dashboard! By the end of this course, you'll learn how to harness the full power of Excel's BI Toolkit to create a beautiful dashboard, combining all the tools together.
💰 Lifetime Access & 30-Day Money-Back Guarantee 🏷️ You have lifetime access to the course materials and the option to get your money back within 30 days if you're not satisfied – no risk!
🎓 Who is this course for?
- Anyone with basic Excel knowledge
- Data Analysts & MIS Professionals
- Business Analysts & Managers
- Dashboard Makers & BI Professionals
- Students eager to learn advanced Excel skills
Upon completion, you will receive a Certificate of Completion.
💬 STUDENT REVIEWS 💬
- "I highly recommend this course. It was exactly what I needed..." - Troy Newman
- "A thorough tutorial on using all the Excel BI Toolkit... Highly recommend!" - Albert Loomer
- "Andreas helps the viewer use Excel skills to produce truly useful dashboards. Highly recommend for those looking to learn data presentation." - David Anderson
🎉 Join thousands of students who have already enhanced their data analysis and presentation capabilities with this comprehensive course! 🎉
Enroll now and embark on your journey to becoming an Excel Data Analyst Master! 🎓✨
Course Gallery


Loading charts...
Comidoc Review
Our Verdict
The 'Excel Power Query, Power Pivot, DAX, Power BI & Power 3D Map' course is an informative resource for data analysts seeking to enhance their skills in Excel. The strong focus on core elements of Power BI and hands-on approach ensures students can easily grasp the concepts presented throughout the modules. Although some minor improvement points such as a more structured course design, prompt file availability checks, and expanded advanced exercises are raised by several learners, the overall positive feedback highlights its relevance and importance in today's data-driven world.
What We Liked
- The course offers in-depth knowledge on Power Query, PowerPivot, DAX, Power BI, and 3D Maps tools.
- Clear explanations and exercises enable easy understanding of data transformation techniques, useful for both beginners and intermediate learners.
- Instructor provides real-world examples and projects to apply the concepts learned in each module.
- High-quality video lectures ensure lifetime access to content with an experienced instructor available to answer queries within 24 hours.
Potential Drawbacks
- Course design could benefit from more structure, as the lectures sometimes seem disjointed and lack continuity.
- Missing or inaccessible files pose challenges for some learners, requiring prompt follow-ups with the instructor or community.
- Some areas of the course cover basic content which may be insufficient to satisfy advanced users' needs.
- Minor issues related to typos and inconsistent financial terms are noted but don't significantly detract from learning experience.