Statistics for Data Analysis Using Python

Why take this course?
🚀 Course Title: Statistics for Data Analysis Using Python
🎓 Headline: Learn Python from Basics • Descriptive, Inferential Statistics • Plots for Data Visualization • Data Science 🎉
Welcome to the World of Data Mastery! 📊
Whether you're a complete beginner in both statistics and Python, or looking to solidify your understanding of data analysis, this course is tailored to cater to all your needs. By the end of this journey, you'll be able to perform sophisticated statistical calculations using Python with confidence! 💪
Why Take This Course? 🤔
- No Prior Knowledge Required: You don't need any coding background to start – I'll guide you through the basics step by step. 🧬
- Hands-On Learning: With coding exercises designed to test your learnings, you'll apply what you've learned in real-time. 🖥️
- Historical Context: Understand the intuition behind statistical tests even without a computer – we'll cover how to perform these calculations manually, as if it were the 1960s! ♫
- Real-World Application: Learn to apply statistical concepts and Python in your workplace for practical, impactful results. 🏢
Course Structure Overview: 📚
Descriptive Statistics:
- Mean, Mode, Median, Quartile, Range, Inter Quartile Range, Standard Deviation, and more! You'll learn to measure the center and spread of data like a pro. 🎯
Data Visualization:
- Master the art of visual storytelling with Python libraries Matplotlib.pyplot and Seaborn. Learn to create:
- Histograms 📊
- Box and Whisker Plots 📈
- Scatter Plots 🌱
Probability:
- Get a grip on the fundamentals of probability, including understanding Permutations and Combinations. 🎲
Population and Sampling:
- Grasp the basics of populations and sampling, the foundation of any statistical study. 🌫️
Probability Distributions:
- Explore the Normal, Binomial, and Poisson distributions to understand the patterns in data. 📈
Hypothesis Testing:
- Dive into one-sample and two-sample tests with z Test, t-Test, F Test, and Chi-Square Test. 🎯
ANOVA:
- Perform Analysis of Variance (ANOVA) from scratch and see how Python can simplify the process. 🔬
Goodness of Fit & Contingency Tables:
- Learn to assess the fit of probability distributions and analyze categorical data with contingency tables. 🧠
By the end of this course, you'll be equipped with the knowledge and skills to analyze data like a statistically savvy Python programmer. Whether you're looking to advance in your current role or aiming for a career in data science, this course will provide you with a robust foundation in statistics using Python. 💻
Enroll now and embark on an exciting journey into the world of data analysis! 🚀
Instructor: Sandeep Kumar, Quality Gurus Inc.
Sandeep is a seasoned data analyst with years of experience in transforming complex datasets into actionable insights. With a passion for teaching and a knack for simplifying complex concepts, Sandeep is the perfect guide to take you through this comprehensive course on statistics and Python. 👩🏫✨
Course Gallery


Loading charts...
Comidoc Review
Our Verdict
This Statistics for Data Analysis Using Python course serves as an excellent resource for learners seeking solid foundations in both theoretical and practical aspects of statistics. The course incorporates real-world examples and covers a wide array of statistical tests while gradually guiding students through their implementation using the Python programming language. Although starting slowly, the course progresses to more complex topics, ensuring students are well-prepared for data analysis tasks ahead. However, be prepared for heavy theoretical content, with little focus on Python development or advanced regression analysis methods.
What We Liked
- The course strikes an optimal balance between theoretical statistics concepts and their practical implementation using Python.
- Complex statistical methods, such as ANOVA, are broken down into easy-to-understand steps with clear explanations and examples.
- Real-world scenarios are used to demonstrate the importance of data preparation for advanced statistical tests.
- Instructor provides a GitHub repository for future reference, covering topics like one & two-sample z-tests, t-tests, Chi-Square tests, F-tests, ANOVA, and probability distributions.
Potential Drawbacks
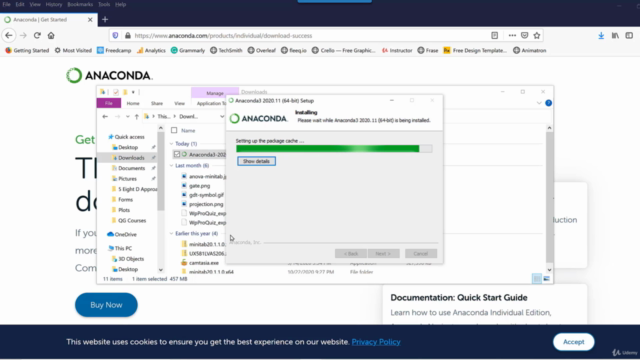
- The course starts with very basic content which may be too simple for some learners, such as downloading Anaconda.
- The heavy emphasis on theory might not appeal to students interested in Python development specifically.
- There is no coverage of regression analysis or non-parametric statistical tests in this course.
- Some users might find the instructor's thick accent challenging to understand at first, although adaptation occurs over time.