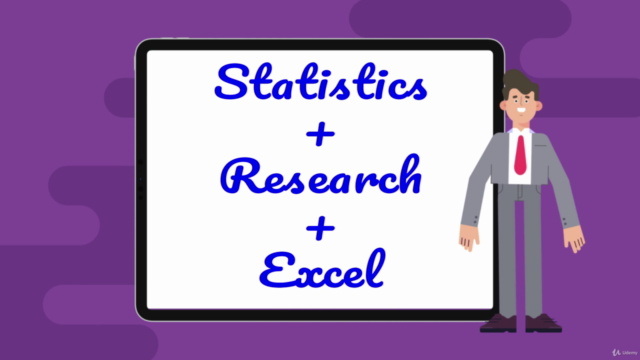
Statistical Analysis and Research using Excel

Why take this course?
🚀 Course Title: Statistical Analysis and Research using Excel 📊
Headline: Dive into the World of Data: Master Statistical Formulas and Data Analysis in Excel!
Course Description:
Welcome to the Statistical Analysis and Research using Excel course, where theory meets practice, and your analytical skills are honed to perfection! This isn't just a course; it's a journey into the realm of data, designed to equip you with the tools and knowledge to conduct robust statistical analyses and research projects within the versatile confines of Microsoft Excel.
Why Take This Course?
- Foundational Skills: Build a strong foundation in statistical analysis, which is essential for all levels of analytical studies and research.
- Practical Application: Learn by doing! Engage with real-world scenarios and datasets that mirror the challenges you'll face in your professional life.
- Industry Relevance: The course content is tailored to reflect actual industry applications, providing you with a competitive edge in the job market.
- Versatile Learning: Whether you're considering further education in research and analytics or looking to enhance your current skill set, this course serves as an ideal stepping stone.
What Will You Learn?
📈 Key Takeaways:
- Understand the core statistical concepts and their significance in data analysis.
- Master Excel's built-in functions for descriptive statistics (mean, median, mode, etc.).
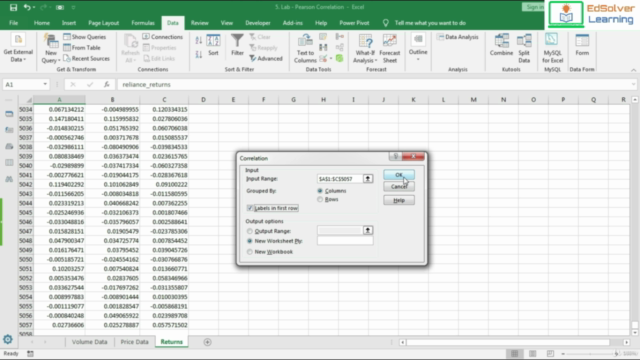
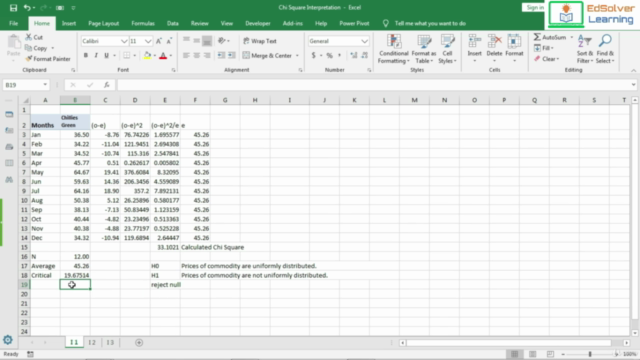
- Learn to perform inferential statistics (hypothesis testing, regression analysis, etc.) within Excel.
- Gain proficiency in data visualization and interpretation using charts and graphs.
- Apply your knowledge to various datasets, including real-life business scenarios.
Course Highlights:
- Interactive Learning: Engage with interactive exercises that simulate real-world analytical challenges.
- Diverse Datasets: Work with a range of datasets to understand different types of data and their applications.
- Advanced Techniques: Explore advanced Excel features like array formulas, pivot tables, and Power Query for more efficient data manipulation.
- Educational Resources: Access comprehensive resources that include instructional videos, reading materials, and quizzes to reinforce your learning.
Who Is This Course For?
- Aspiring or current Data Engineers who want to enhance their analytical skills using Excel.
- Data Analysts looking to refine their statistical analysis techniques.
- Professionals in Marketing Research aiming to deepen their understanding of data analysis within Excel.
- Students and academics who wish to build a bridge between theory and practical application in statistics and research.
Embark on this learning adventure with EdSolver Learning and transform the way you view and interact with data. Whether you're aiming for professional growth or academic pursuit, this course is your gateway to becoming a proficient Statistical Analyst using Excel. 🌟
Enroll now and take the first step towards mastering statistical analysis and research!
Course Gallery


Loading charts...