Python Data Visualization Mastery: From Beginner to Expert
Master Data Visualization in Python: Learn to Create Compelling Charts and Visual Representations of Your Data.

3
students
3 hours
content
Jun 2025
last update
$19.99
regular price
What you will learn
Basic Principles of Effective Visualization
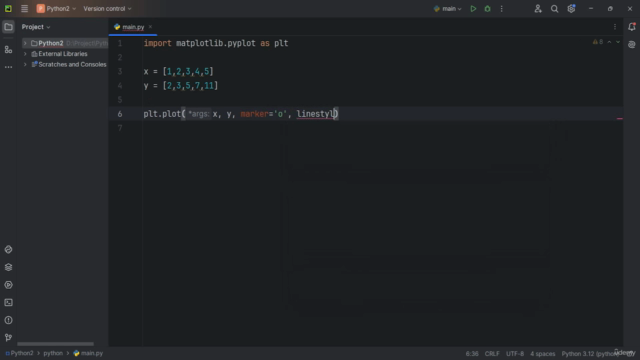
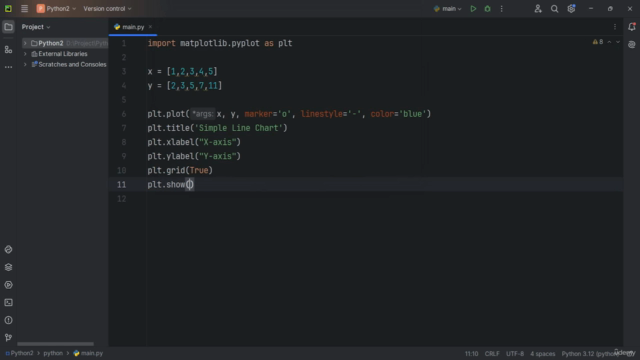
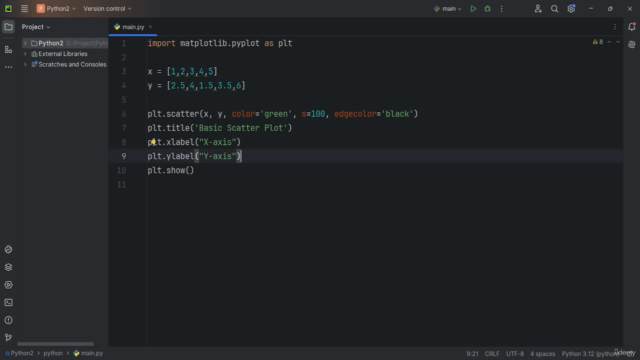
Creating Simple Plots (line, bar, scatter)
Customizing Plots (colors, markers, labels)
Distplot and Histogram
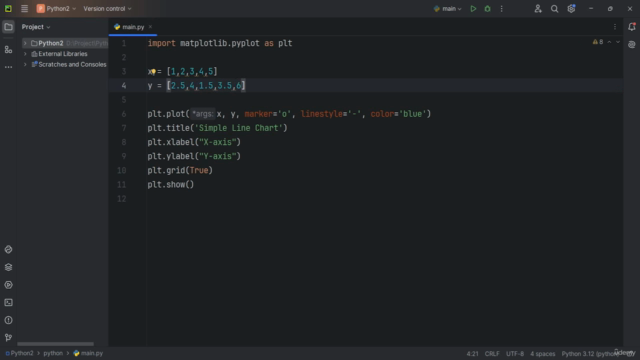
Line Charts and Scatter Plots
Bar Charts and Histograms
Dashboards and Interactive Visualizations
Geospatial Data Visualization
Customizing Visualizations with Templates
Creating Interactive Dashboards
Analyzing and Visualizing a Real World Dataset
Building Interactive Dashboards to Explore Data
Deploying Visualizations to Web Platforms
Course Gallery
Loading charts...
6695873
udemy ID
30/06/2025
course created date
02/07/2025
course indexed date
Bot
course submited by