Primavera & Power BI Integration | Interactive Dashboards
Why take this course?
🚀 Course Title: Primavera & Power BI Integration | Interactive Dashboards
🎓 Headline: Master the Art of Data with Eslam Gharib - Learn to Integrate Power BI with Primavera P6 for Stunning Project Dashboards!
Unlock the Power of Data Analysis with Ease!
Are you ready to transform your project management experience? With Microsoft Power BI, you can harness the power of data analysis and interactive visualization effortlessly. As a free tool available for anyone to sign up, Power BI has become the go-to solution for creating compelling reports and dashboards that bring your data to life.
Why This Course?
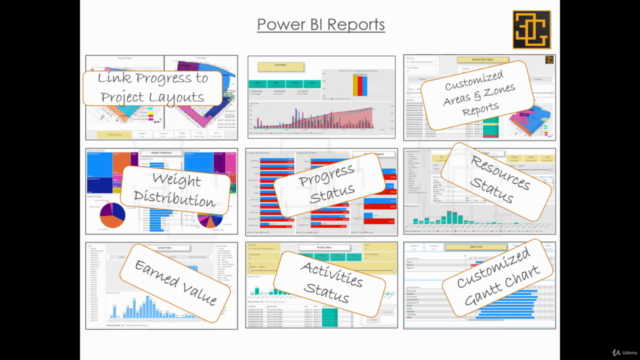
This comprehensive course is designed to guide you through the process of integrating Power BI with Primavera P6, enabling you to prepare interactive reports and project dashboards that provide deep insights into your projects. Whether you're managing a construction project, planning events, or simply looking to streamline your data management process, this course will equip you with the skills necessary to make informed business decisions on the go.
What You'll Learn:
- Step-by-Step Integration: I will take you through each step, from adjusting your Primavera program to preparing the database and creating Power BI interactive reports.
- Real-World Applications: Learn through a full example using a realistic scenario - the management of a five-star hotel.
- Interactive Learning: Understand how to publish and access your dashboards across various devices, including smartphones and tablets.
- Troubleshooting Tips: I'll share all the tricks and hurdles you may encounter during integration, ensuring you're well-prepared for any challenges.
Course Breakdown:
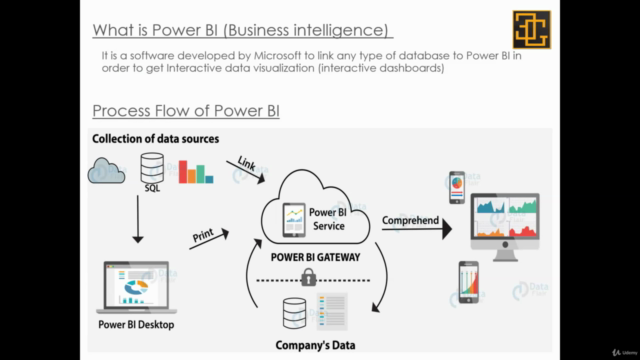
🚀 A. Power BI Overview - Get acquainted with the features and capabilities of Microsoft Power BI.
📊 B. Install Power BI Desktop - Learn how to set up Power BI Desktop on your computer.
⚙️ C. Adjust Primavera Programme - Discover how to fine-tune your Primavera programme for optimal integration.
📈 D. Adjust the Database, Using Excel - Gain expertise in adjusting your databases with Excel to feed into Power BI.
🔍 E. Check the Values in Power BI - Verify that your data is accurately reflected within Power BI.
👀 F. Explore Visuals - Dive into the world of visuals and discover how to make your data more accessible and understandable.
📝 G. Filters & Slicers - Learn to use filters and slicers for a more granular view of your data.
✨ H. Measure and New Columns Calculations - Master calculations within Power BI to extract meaningful insights from your data.
🤝 I. Link Power BI to the Project Layouts - Connect your Power BI dashboards with your Primavera project layouts for a seamless experience.
🎥 J. Case Study: Complete 5-Star Hotel Example - Follow along with a comprehensive, real-world example that showcases the integration process from start to finish.
📱 K. Publish / Share the Report, Using the Mobile Application - Learn how to publish and share your reports on mobile devices for on-the-go access and decision-making.
By the end of this course, you'll be equipped with the knowledge and skills to effectively link Power BI to Primavera P6, prepare interactive reports, and create project dashboards that will not only impress but also drive your business decisions with confidence. Enroll now and embark on a journey towards data-driven success! 🌟
Course Gallery
Loading charts...