Power BI Masterclass - beginners to advanced

Why take this course?
🚀 Embark on Your Data Journey with the Power BI Masterclass!
Are you ready to supercharge your career in the data-driven world? 🌟 Unlock the door to exciting job opportunities and excel in your work by mastering Microsoft Power BI with our hands-on Power BI Desktop course for beginners. This is your golden ticket to becoming a data expert and unlocking a world of possibilities.
Why Power BI? In today's data-centric landscape, businesses thrive on informed decisions, and data analysts are in high demand. Microsoft Power BI is your key to stepping into this realm of opportunities. The best part? You don't need any coding skills - Power BI offers an intuitive, user-friendly interface that anyone can master. 🖥️
Your Path to Expertise Begins Here Our comprehensive 14-hour up to date course is designed for data enthusiasts, whether you're just starting out, looking to switch careers, or already a seasoned professional within your organization. We guide you from the fundamentals to advanced concepts, ensuring you gain a deep understanding of Power BI's capabilities.
Hands-On Learning This isn't your typical lecture-style course. Get ready to roll up your sleeves and dive into real-world data scenarios. Our hands-on approach ensures you not only learn but also apply what you learn immediately, turning knowledge into skill. 🛠️
What You'll Gain:
- Transform messy data into meaningful insights with Power BI's ETL capabilities.
- Master simple and advanced DAX calculations.
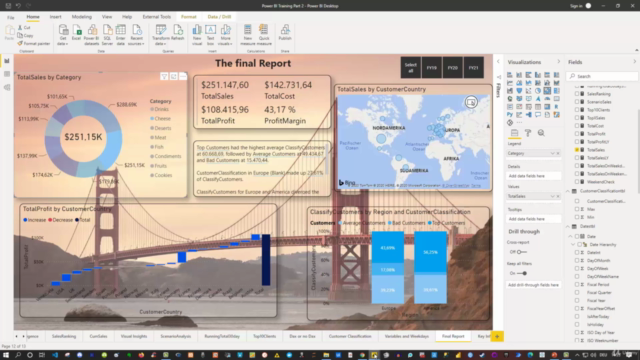
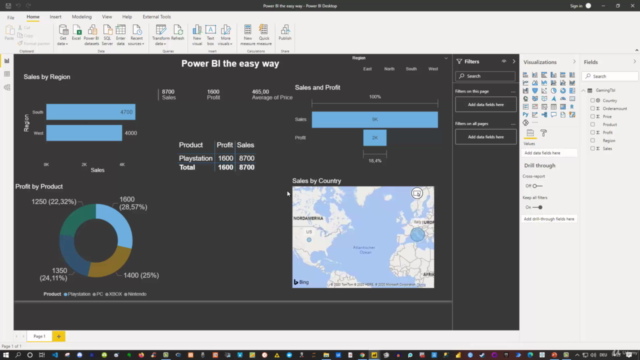
- Create stunning visualizations and reports that impress employers and clients.
- Acquire the skills to pass the Power BI certification exam with flying colors.
A World of Opportunities The world needs data experts, and by enrolling in our Power BI Masterclass Series on Udemy, you're embarking on a journey towards career excellence. This first course is just the beginning. Our series of 12 courses will turn you into a Power BI guru, covering advanced DAX techniques, Power BI features, tips, tricks, and best practices in report creation.
Don't Wait! Join Us Today The future belongs to data experts. Don't miss your chance to excel in your career, open doors to exciting job opportunities, and thrive in a data-driven world. Enroll now and start your journey towards becoming a Power BI master! 🚀
With our expert-led course, you'll not only understand the mechanics of Power BI but also learn how to leverage its full potential. Whether you're analyzing complex datasets or presenting critical information to stakeholders, Power BI is the tool that will set you apart.
Enroll today and take the first step towards becoming a certified Power BI professional! 💻✨
Course Gallery


Loading charts...
Comidoc Review
Our Verdict
Microsoft Power BI Masterclass stands out as an extensive course, bridging the gap between beginners and advanced users. The instructor's clear explanations and practical examples lay a solid foundation for learning Power BI. However, to fully master DAX formulae and gain insights from diverse real-life scenarios, one might need to explore additional resources. This Masterclass remains a strong starting point in the data analytics career path while cultivating a desire for continuous skill development.
What We Liked
- Comprehensive coverage of Power BI, from basic to advanced level
- Instructor explains steps clearly, beneficial for beginners
- Practical examples that align with real-world data visualization requests
- Regular updates to reflect the evolving Power BI platform
- Excellent additional resources, including DAX measures
Potential Drawbacks
- Limited focus on developing custom DAX formulae
- Usage of pie and donut charts could be reduced in favor of more frequently used visualizations
- Lack of case studies from various industries for more diversified learning
- Occasional repetition might affect the pace for some learners