Power BI Dashboard Step by Step

Why take this course?
📊 Master Business Intelligence with Power BI: A Step-by-Step Journey
Course Headline:
Business Intelligence, Data Connection, Power Query Basics, Creating Visuals, DAX, Dashboards
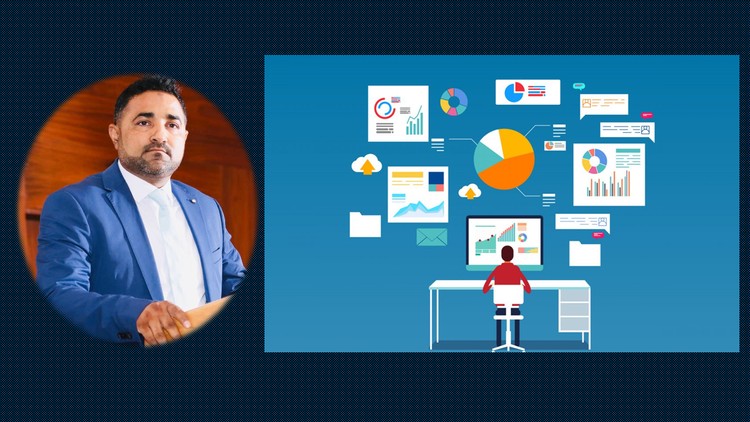
As featured in Gartner Report, Power BI has revolutionized the way we approach Business Intelligence (BI). It's not just about crunching numbers; it's about transforming data into actionable insights that drive decision-making. 🧠✨
Why Power BI? With the rise of data analytics, tools like Excel have been the go-to for creating charts and graphs. However, the advent of Power BI has taken data visualization to a whole new level. It's designed to empower users to create insightful dashboards and reports swiftly and efficiently, making it the tool of choice for professionals across industries.
Course Description: Data analysis is more than just numbers—it's about storytelling with data. Whether you're a budding analyst or a seasoned business intelligence professional, this course will equip you with the skills to transform raw data into compelling narratives using Power BI.
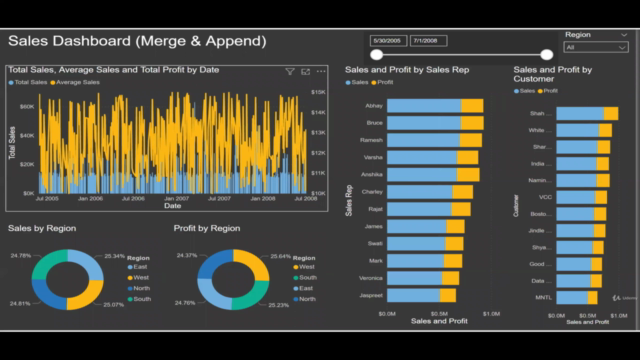
What You Will Learn: 🚀 Power BI Dashboard Creation:
- Learn the fundamentals of creating dashboards that bring your data to life.
- Discover simple and efficient methods for preparing impactful reports.
📈 Data Modeling with DAX:
- Understand the basics of Data Analysis Expressions (DAX) to manipulate and calculate complex data structures.
🔖 Data Connection & Power Query:
- Master connecting various data sources using Power Query.
- Learn to clean, shape, and model your data for precise analysis.
Prerequisites: ✨ Basic Excel Knowledge:
- Familiarity with Excel will be beneficial but not mandatory as we'll cover all the essentials within this course.
Who This Course Is For:
- Power BI Beginners: Whether you're new to Power BI or looking to solidify your understanding, this course will serve as a comprehensive guide.
- Data Analysts: Enhance your skillset with advanced visualization techniques and data manipulation capabilities.
- Dashboards Lovers: If you have an eye for design and a passion for data, learn how to create dashboards that tell a story.
- Business Intelligence Professionals: Take your BI expertise to the next level with hands-on experience in creating dashboards that inform business strategies.
Embark on your journey towards becoming a data hero with this course. You'll learn to navigate the vast capabilities of Power BI, transforming complex datasets into intuitive visuals and reports that are both insightful and beautiful. 🚀💡
Enroll now and unlock the potential of your data! 🌟📊
Course Gallery


Loading charts...