Power BI Custom Visuals Mastery

Why take this course?
🌟 Course Title: Power BI Custom Visuals Mastery
Headline: Enhance Your Data Storytelling with Advanced Visualizations 🚀
📘 Course Description:
Are you ready to unlock the full potential of your data and elevate your storytelling in Power BI? Dive into the world of advanced visualization with our comprehensive course, "Power BI Custom Visuals Mastery." This expertly crafted curriculum is designed to guide you through the intricacies of developing your own custom visuals—tools that will enable you to push beyond the conventional and create truly unique and engaging data experiences.
What You Will Learn:
-
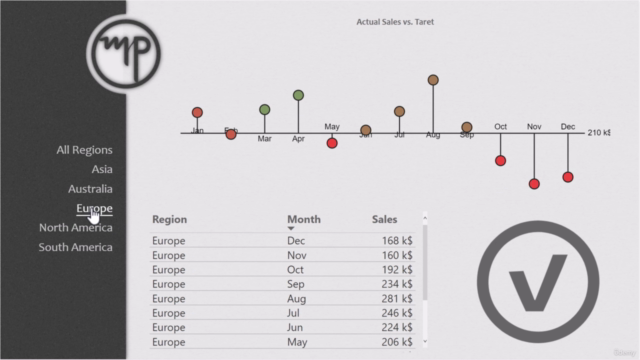
Custom Slicer Creation: Design an interactive, easy-to-use slicer that allows users to filter data with a single click, complete with a reset option for effortless navigation.
- Learn how to simplify complex data sets with intuitive interfaces.
-
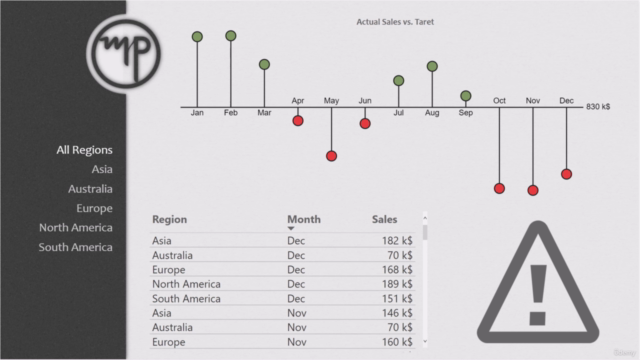
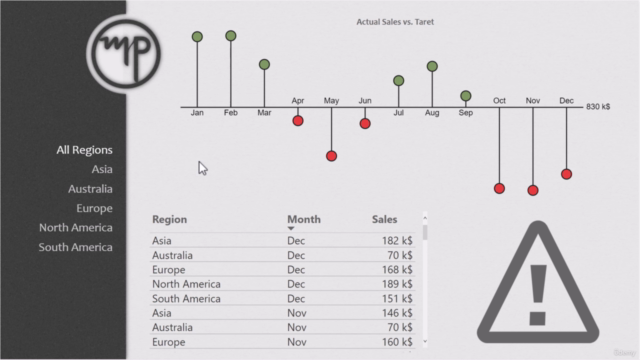
Lollipop Chart Development: Build a chart that compares actual performance against targets in an visually compelling way. This visual will come equipped with interactive tooltips, cross-filtering, and cross-highlighting capabilities, as well as conditional formatting options for a dynamic user experience.
-
KPI Label Design: Create labels that dynamically adapt to different KPI values, showcasing icons to indicate performance against targets. Discover how to incorporate external SVG designs to add a touch of creativity and professionalism to your custom visuals.
Key Takeaways:
✅ Structural Understanding: Gain a deep insight into the architecture of a custom visual project within Power BI.
✅ Interactive Features: Implement essential features such as tooltips, cross-filtering, and cross-highlighting to create an interactive environment for your data analysis.
✅ Advanced Formatting: Master the art of conditional formatting to make your visuals more informative and visually appealing.
✅ Power BI Tools Utilization: Learn to leverage Microsoft Power BI Visuals Formatting Utils and powerbi-models to their fullest potential.
✅ SVG Integration: Embed external SVG graphics to add custom icons and designs to your visuals, making them truly one-of-a-kind.
📝 Important Note: This course is tailored for those who have a foundational understanding of D3.js. If you're new to D3.js, we recommend starting with our "D3.js - The Art of Data Visualization" course to build a strong foundation before jumping into this advanced content.
🎓 Why Enroll?
By mastering the skills taught in this course, you will be equipped to transform your data into captivating visual stories that engage and inform stakeholders like never before. Whether you're a business analyst, a data scientist, or just passionate about data, "Power BI Custom Visuals Mastery" will empower you to stand out with advanced data visualization techniques.
👨🏫 Instructor: Marek Pilczuk, a seasoned expert in the field of data visualization and custom Power BI solutions.
🌈 Embark on your journey to become a Power BI guru today! Enroll now and start crafting data stories that will captivate your audience and make your reports stand out. ✨
Course Gallery


Loading charts...