Power BI Crash Course

Why take this course?
🌟 Power BI Crash Course: Master Data Analysis in Under 2 Hours! 🌟
Overview of Power BI Desktop
Welcome to the Power BI Crash Course - a dynamic and immersive learning experience designed for those eager to harness the full potential of Microsoft's Power BI Desktop. In just under two hours, you'll embark on a journey from raw data to a sophisticated, interactive dashboard that's ready to be published to a web service.
Course Headline: This isn't just another online course; it's a rapid-fire guide to creating fancy reports and eye-catching dashboards that can transform your approach to data analysis. Whether you're a seasoned business analyst or new to the world of analytics, this course will equip you with the skills you need to make a visual impact with your data.
What You'll Learn: In this crash course, I, Robin Solonenko, will guide you through each step of the process, from connecting to different data sources to publishing your completed work to the web. Here's a sneak peek at the topics we'll cover:
-
Connect to Different Data Sources 🔗 Learn how to easily import data from various sources such as Excel, SharePoint, and SQL Server.
-
Create a Data Table 📊 Start building your data model with confidence.
-
Setting Relationships 🤝 Understand the power of data relationships and how they can streamline your analysis.
-
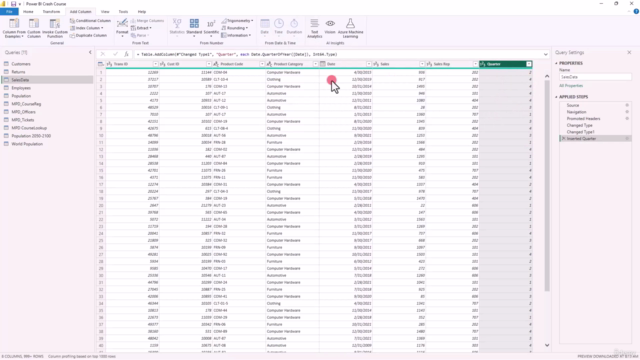
Using the Power Query Editor ⚙️ Master the Power Query Editor for powerful data transformations without writing code.
-
Learn Combining Queries 🔄 Combine queries to create complex, yet efficient, data sets.
-
Use the DAX Functional Language ✨ Utilize the Data Analysis Expressions (DAX) to create powerful calculations and metrics.
-
Difference between Calculated Columns & Measures 🤔 Learn when to use calculated columns vs. measures in your Power BI model.
-
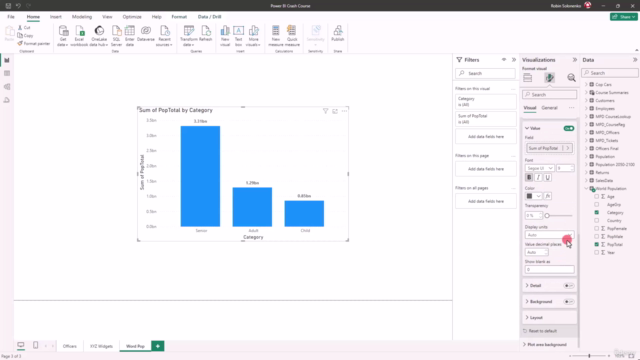
Create Powerful Visuals 🖼️ Turn data into compelling visuals that tell a story and convey insights effectively.
-
Learn to Slice & Dice 🔪 Get hands-on with advanced slicing and dicing techniques to explore your data from multiple angles.
-
Create a Dashboard 📈 Bring all your visuals together into a cohesive and interactive dashboard.
-
Publish to Web Service 🚀 Deploy your dashboard for users across the web to view, interact, and analyze data in real-time.
Why Take This Course? This course is designed for those who want an intense, fast-paced learning experience that gets straight to the point. It's perfect for:
- Data Analysts looking to upskill and add Power BI to their toolkit.
- Business Professionals who need to make data-driven decisions quickly.
- Anyone interested in learning how to turn raw data into actionable insights within a short span of time.
Your Instructor: As your instructor, I, Robin Solonenko, am committed to delivering a comprehensive and engaging course experience that will leave you with the skills to confidently handle any data analysis task using Power BI Desktop.
So, what are you waiting for? Sign up for the Power BI Crash Course today and transform your data into a story that everyone can understand and act upon! Let's make data analysis simple, efficient, and impactful together! 📊🚀
Course Gallery


Loading charts...