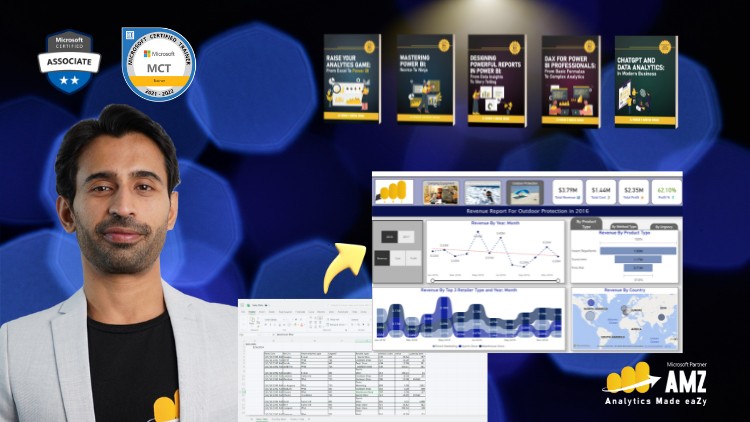
Microsoft Power BI for Beginners & Excel Users

Why take this course?
🚀 Mastering Data Analysis and Dynamic Visualizations with Microsoft Power BI 📊
Course Headline: Mastering Data Analysis and Dynamic Visualizations with Microsoft Power BI - Recorded Live with Executives in Training.
Your Journey to Business Intelligence Mastery Begins Here!
Welcome to a course that transcends the ordinary online learning experience. This isn't just any video tutorial; it's a recording of a live session, where you'll learn alongside business executives and professionals, tackling real-world challenges with Microsoft Power BI. You're not just watching a screen—you're part of an interactive learning community!
🎓 Course Structure Overview:
Unit 1: Introduction to Business Intelligence 🌟
- Overview of Business Intelligence
- What is Business Intelligence and why does it matter?
- The transformative journey from data to actionable insights.
- How Power BI fits into the Business Intelligence process.
Unit 2: Understanding the Data Cycle 🔄
- Exploring the limitations of traditional tools like Excel
- Reviewing different licensing options in Power BI
- Navigating Pro vs Premium, and everything in between.
Unit 3: Data Transformation Techniques in Power BI 🔧
- Introduction to Power BI Query Editor
- Identifying common data issues and how to address them.
- Mastering data cleaning with step-by-step techniques:
- Removing columns and rows
- Setting the first row as header
- Changing data types, replacing values, removing spaces
- Handling errors, renaming, and optimizing steps
- Filling down missing values, splitting columns, removing duplicates
- Tips and tricks for automating data cleaning.
Unit 4: Data Modeling and Enrichment 🏗️
- Basics of data modelling and building relationships
- Understanding filter propagation and cardinality best practices.
- Introduction to data enrichment: Creating calculated columns and measures.
Unit 5: Basics of Data Visualization 🎨
- Familiarization with native and custom visuals in Power BI
- Hands-on creation of various charts (pie, line, bar), tables, and cards.
- Techniques for drilling down hierarchies and setting visual interactions.
- Formatting visuals and reports, including titles, legends, axes.
- Utilizing slicers and different levels of filtering.
- Applying conditional formatting to highlight important data points.
- Embedding images into reports for a personalized touch.
Unit 6: Publishing and Sharing Insights 🌐
- Steps to publish reports and set default user experiences
- Creating and managing workspaces for collaboration.
- Strategies for sharing reports effectively.
- Designing reports for mobile layouts for on-the-go insights.
What You'll Gain:
✅ A Solid Foundation in Business Intelligence: Understand the process of transforming raw data into actionable insights with Microsoft Power BI.
✅ Expertise in Data Transformation: Learn to clean and prepare your data for analysis using Power BI's Query Editor.
✅ Data Modeling Mastery: Build robust data models and enrich your data with calculated columns and measures.
✅ Advanced Visualization Skills: Create compelling visualizations that tell a story and engage your audience.
✅ Real-World Application: Share your findings with ease, whether in a report or through collaboration with colleagues.
By the end of this course, you won't just be another Excel user; you'll be a Business Intelligence professional ready to take on the world with Microsoft Power BI. 🌍💼✨
Enroll now and transform your data into stories that matter! 📈🔍
Course Gallery


Loading charts...