Microsoft Excel Data Analysis for Business & Finance
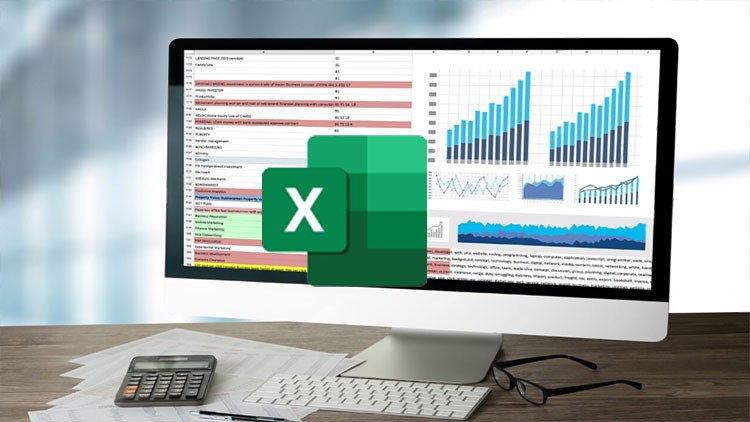
Excel Data Analysis: Learn to clean, analyze and visualize financial & business data using Excel’s most powerful tools.
27
students
4 hours
content
Aug 2025
last update
$19.99
regular price
What you will learn
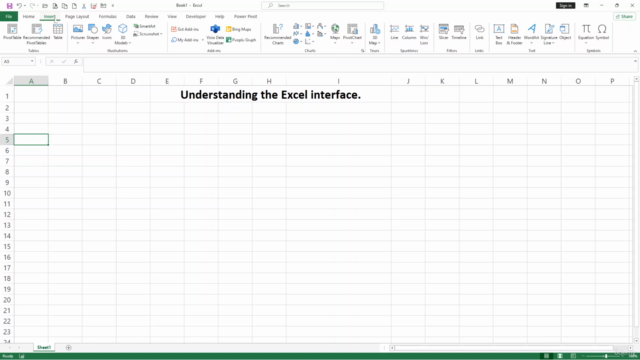
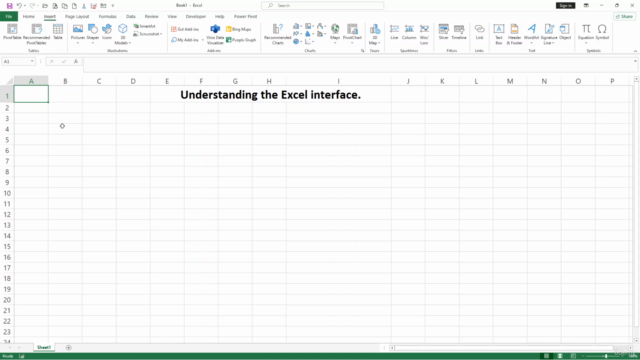
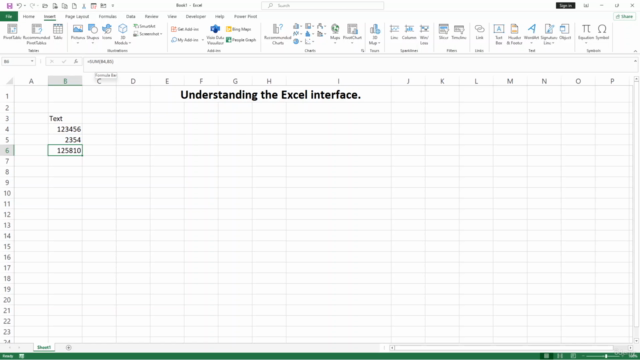
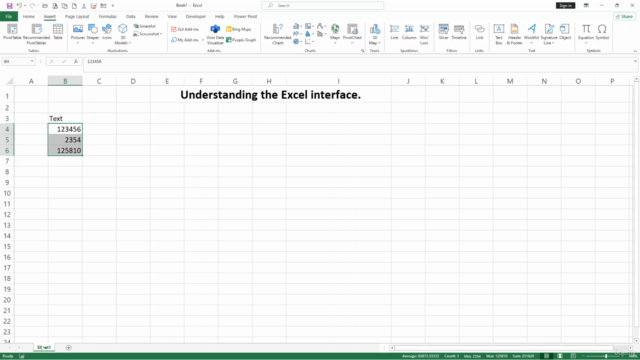
Understanding the Excel Interface.
Navigating Workbooks, Worksheets, and Ribbons.
Saving, Sharing, and Printing Excel Files.
Using Basic Formulas and Functions (SUM, AVERAGE, COUNT).
Understanding Relative, Absolute, and Mixed References.
Sorting and Filtering Data.
Conditional Formatting and Rules.
Using Logical Functions (IF, AND, OR).
Lookup and Reference Functions (VLOOKUP, HLOOKUP, INDEX, MATCH).
Creating Slicers for Dynamic Filtering.
Advanced Filtering Techniques.
Using What-If Analysis (Goal Seek, Scenario Manager, Data Tables).
Creating advanced charts (Waterfall, Histogram, Pareto).
Designing professional dashboards.
Customizing chart elements.
Using sparklines and data bars.
Course Gallery
Loading charts...
6753031
udemy ID
02/08/2025
course created date
05/08/2025
course indexed date
Bot
course submited by