Grafana

Why take this course?
🚀 Master Grafana with Sean Bradley! 📊
Welcome to Mastering Grafana!
Grafana is the go-to open-source platform for visualizing metrics, time series data, and application analytics. It's an incredibly powerful tool that allows you to query, visualize, alert on, and understand your metrics from any source. Whether you're a beginner or looking to deepen your Grafana expertise, this course is designed to guide you every step of the way.
Why Learn Grafana?
- Data-Driven Decisions: Foster a culture of data-driven decision making within your team.
- Versatility: Grafana works with any datasource, be it Prometheus, InfluxDB, Elasticsearch, CloudWatch, or even LDAP!
- Community Trust: Join the thousands who trust Grafana for their monitoring and analytics needs.
What You'll Learn 🎓
In this Learn by Example course, you'll not only learn but also see each concept in action. With hands-on demonstrations, you can follow along and apply what you learn directly to your own setup. Here's a sneak peek of the topics we'll cover:
Installation and Configuration:
- Setting Up Grafana: Learn how to install Grafana from packages, configure SSL, and change default ports for security and professionalism.
Panel Exploration:
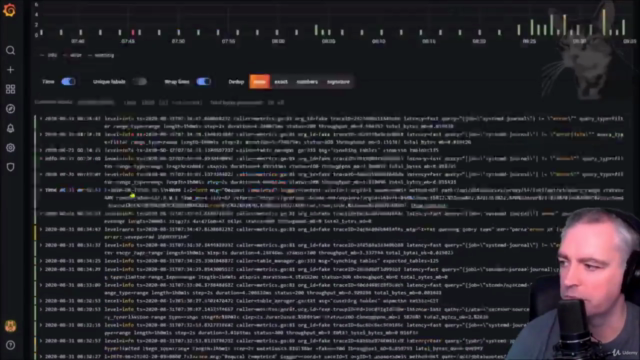
- Variety of Panels: Dive into creating dashboards with a range of panels including Graph, Stat, Gauge, Bar Gauge, Table, Text, Heatmap, and Logs.
Data Sources:
- Versatile Data Sources: Create and configure data sources from popular options like MySQL, Zabbix, InfluxDB, Prometheus, and Loki.
Collectors and Monitors:
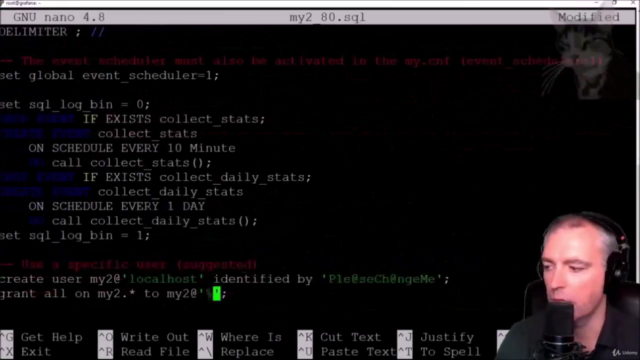
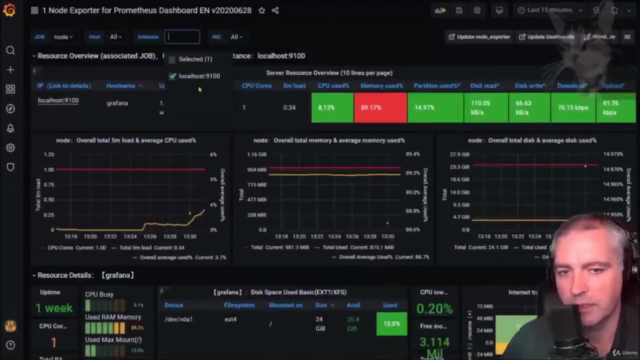
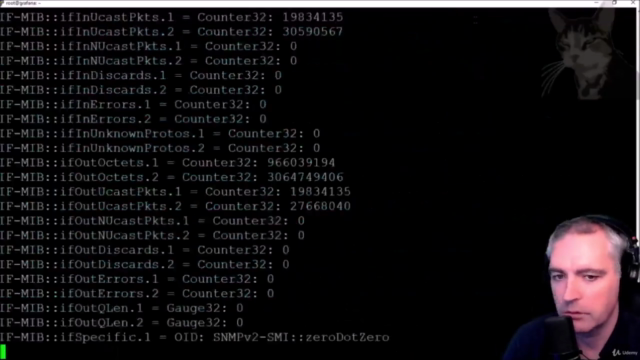
- Advanced Collection Techniques: Configure collectors such as MySQL Event Scheduler, Telegraf, Node Exporters, SNMP agents, and Promtail to fetch your data.
Time Series Data vs. Non Time Series Data:
- Tackling Different Data Types: Grasp the nuances of graphing both Time Series and Non Time Series data effectively in Grafana.
Dashboard Customization:
- Dynamic Dashboards: Experiment with dynamic dashboard variables, tables, and graphs to create a truly interactive experience.
Tagging and Grouping:
- Value Groups/Tags: Understand how to use tags and groups for different kinds of data sources to enhance your visualizations.
Alerting and Notifications:
- Setting Up Alerts: Configure alerting channels, contact points, and demonstrate real-world examples like receiving email alerts via a local SMTP server.
What You'll Get 🎁
By the end of this course, you will have your very own dedicated Grafana server in the cloud, equipped with SSL, a domain name, and a host of example data sources and collectors. This is a platform ready for you to expand upon, tailor to your specific needs, and take to the next level.
-
Comprehensive Documentation: Access free documentation to match what you see in the videos, copy/paste directly from the provided materials, and achieve consistent results.
-
Real-World Scenarios: This course isn't just theory—it's packed with real-world examples that show how Grafana can be applied in various situations.
Get Ready to Dive In! 🏊♂️
Whether you're new to monitoring or an experienced user looking to refine your skills, this course is designed to provide you with the knowledge and tools you need to master Grafana. With a blend of video demonstrations, real-world examples, and hands-on practice, you'll be well on your way to becoming a Grafana pro.
So, are you ready to unlock the power of Grafana? Let's embark on this learning journey together! 🧭
Thank you for choosing Sean Bradley's Grafana course. I look forward to guiding you through the world of metrics and visualizations. See you inside the course! 😄💻
Course Gallery


Loading charts...
Comidoc Review
Our Verdict
This course offers a thorough introduction to Grafana, its tools, and common data sources while providing real-life examples to aid understanding. However, some sections might be overly rapid, leaving learners somewhat confused. Additionally, updated content addressing outdated software versions and compatibility issues would further enhance the learning experience.
What We Liked
- Comprehensive coverage of Grafana and its features with real-life examples to aid understanding
- Expert instructor providing in-depth explanations for various services, connections, and data sources
- Hands-on approach allowing learners to build a sandbox environment using common data sources
- Clear and concise video lessons structured for easy following, even for beginners
Potential Drawbacks
- Rapid pace of instruction may cause confusion or require frequent pauses for some learners
- Outdated software versions and server connections causing compatibility issues in certain instances
- Limited focus on specific Grafana dashboard configurations, with a preference for broader overviews
- Insufficient coverage of key concepts such as cardinality, custom metrics, and best practices for building effective dashboards