Excel Data Analysis With Pivot Tables & Pivot Charts - 2025

Why take this course?
🌟 Unlock the Power of Data with Excel! 📊🎓
Student Reviews: A Stamp of Approval!
- "I'm thrilled to say that this course is a goldmine for deep knowledge on data analysis - Mohammad M."
- "Wonderful Course. Really Loved it!" 💖 - Syed Gohar A.
- "The instructor has good knowledge about the topic, and it's a great course to learn Pivot Tables and Pivot Charts in a short time - Nuha Fathy."
Course Overview: Mastering Excel Data Analysis
🚀 Why Enroll?
- Learn at your own pace with comprehensive chapters.
- Engage with practical examples and real-world applications.
- Get expert insights from A.M.A.M. Mubeen, a seasoned professional in data analysis.
🏆 What You Will Gain:
- A step-by-step approach to conducting data analytics using Pivot Tables and Charts.
- Hands-on experience with Excel's powerful tools for data visualization and manipulation.
- The ability to turn raw data into meaningful insights that can drive decision-making processes.
Course Curriculum: A Structured Journey Towards Data Mastery
Chapter 1: Introduction to Pivot Tables and Charts
Dive into the fundamentals of Pivot Tables and Charts, understanding their importance in data analysis.
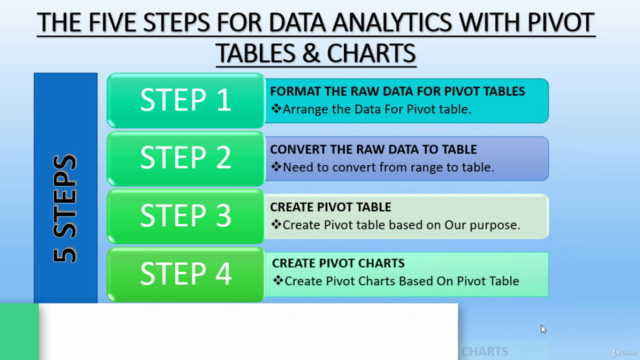
Chapter 2: The Five Steps for Data Analytics with Pivot Tables and Charts
A structured process to follow, ensuring you don't miss a beat when it comes to analyzing your data.
Chapter 3: Pivot Table & Chart Example -01
Get your hands dirty with an initial example, putting theory into practice and understanding the mechanics behind Pivot Tables and Charts.
Chapter 4: Format The Raw Data For Pivot Tables (Step 01)
Learn how to prepare your data for analysis, including formatting and creating new columns where necessary.
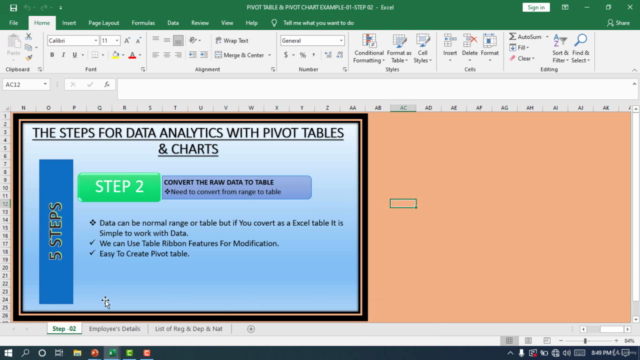
Chapter 5: Convert The Raw Data To Table (Step 02)
Discover the best practices for converting raw data into a table format that's compatible with Pivot Tables.
Chapter 6: Create Pivot Tables (Step-03)
Step-by-step instructions on how to create Pivot Tables, including tips on naming, design, and custom calculations.
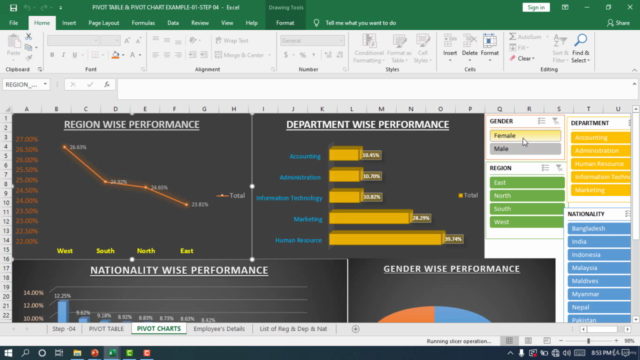
Chapter 7: Create Pivot Charts (Step-04)
From Line to Bar to Pie Charts, learn how to effectively visualize your Pivot Table data with a variety of chart types.
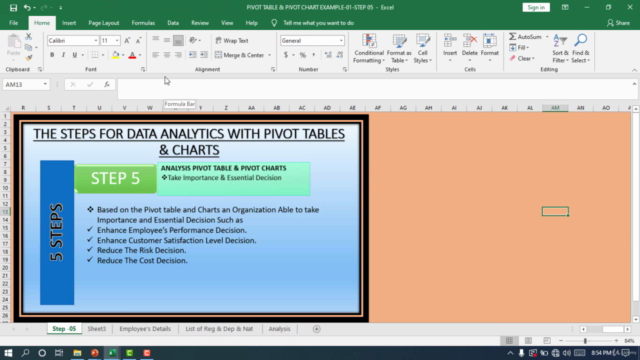
Chapter 8: Analysis The Pivot Table & Pivot Charts (Step-05)
Learn how to analyze and interpret the results from your Pivot Tables and Charts, extracting valuable insights for decision-making.
Chapter 9: Pivot Table & Pivot Chart Example -02
A comprehensive walkthrough of another practical example, applying what you've learned to solve real-world data problems.
Why Wait? Join Us Today!
🎉 Enroll now and kickstart your journey towards becoming an Excel Data Analysis pro. With A.M.A.M. Mubeen's guidance, you'll be ready to tackle any data challenge that comes your way.
Enroll Now and Transform Your Approach to Data!
Click the "Enroll" button and embark on an enriching learning experience. We look forward to welcoming you into Chapter 1 and beyond!
Cheers to your success in data analysis with Excel!
- A.M.A.M. Mubeen 📈🤝
Course Gallery


Loading charts...