Visually Effective Excel Dashboards

Why take this course?
🌟 Master Microsoft Excel Dashboards with Actionable Excel Tips! 🌟
Course Title: Actionable Excel Tips (Templates Included) You Can Use Right Now to Create Eye-Catching Microsoft Excel Dashboards
Course Instructor: Leila Gharani
Course Headline:
Transform Your Data into Insightful Visuals with Excel!
Are you ready to dive into the world of data visualization and master the art of creating impressive, interactive Microsoft Excel Dashboards? If so, this is the course for you! 🚀
Course Description:
What you'll learn:
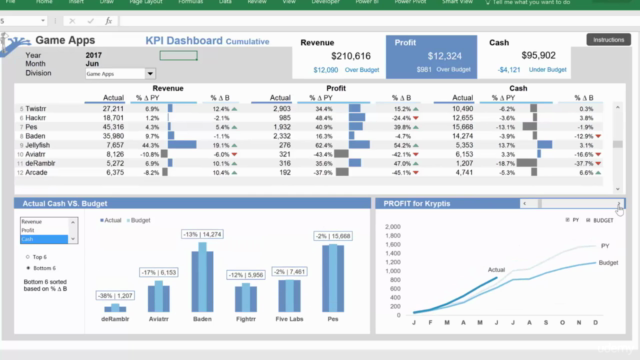
This course is designed to teach you how to create well-designed Excel dashboards so you and your colleagues can see trends and make quick decisions informed by data. You will get your hands on:
Why choose this course?
Enroll now to take the first step towards becoming an Excel Dashboard expert! 📊✨
Course Gallery


Loading charts...
Comidoc Review
Our Verdict
Given its strong focus on practical dashboard creation with an engaging instructor, this 11-hour Visually Effective Excel Dashboards course earns its 4.65-star rating. The actionable tips and clever techniques showcase Excel's power in delivering sleek, responsive reports that can boost decision-making processes. Despite room for improvement in incorporating chapter assessments and generalizing case scenarios, the course offers an engaging way to enhance your Excel skills and produce professional-looking KPI dashboards – with a potential ‘Excel guru’ fame awaiting you at work.
What We Liked
- Comprehensive coverage of Excel dashboard creation, from basics to advanced techniques (e.g., Index & Match functions, non-standard charts)
- Actionable tips and clever use of core functionality for responsive, interactive reports
- Complemented with hands-on exercises that allow learners to practice and apply new skills
- Instructor praised for clear explanations and engaging teaching style
Potential Drawbacks
- A couple of reviewers requested assessments/assignments at the end of each chapter
- Course occasionally feels too focused on case scenarios and lacks general applicability
- Some learners may find a few lessons familiar, calling for more unique angle or content
- Needs updating to include new Excel features and methods (as of 2025)