Excel with Interactive Excel Dashboards
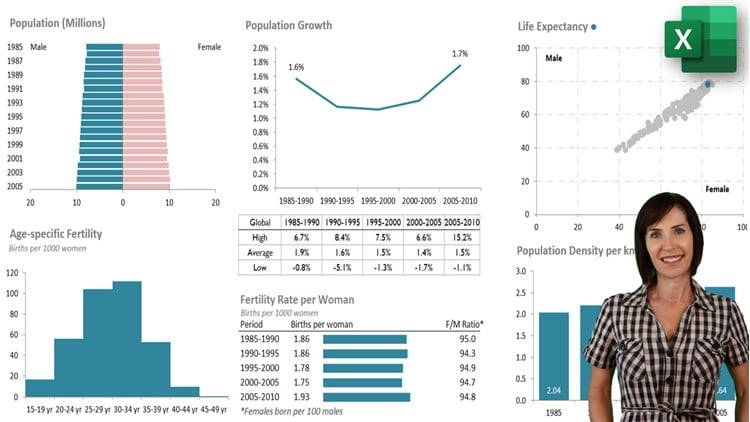
Why take this course?
🌟 Unlock the Power of Data with Excel Dashboards! 🌟
Course Headline:
Learn how to create amazing interactive Excel Dashboards that will wow your boss & take your career to the next level. Lifetime access on Udemy - No subscription fees!
Course Description:
Excel Dashboards are an invaluable tool for anyone looking to communicate and summarize complex data efficiently and effectively. They serve as a powerful way to present key information at a glance, making them ideal for sharing across teams. With the right skills, you can transform raw data into a story that stakeholders can understand and act upon swiftly.
Real Impact: Unsolicited testimonials from past students include:
- A Financial Analyst who saw a $28,000 salary increase after mastering these skills.
- A Senior Financial Analyst who landed a role commanding a $60,000 salary after finalizing their dashboard.
- A Senior Business Analyst who secured a position at $70,000 and a promotion, all starting the week they took this course.
James C., one of our students, shared: "Taking Mynda Treacy's course has honed my skills and led to two promotions and a reputation for being a go-to expert. I am also energized to learn more."
Dielle B., another satisfied learner, noted: "I signed up for this as continuing professional education (CPE) for my CPA license but ended up learning so much more than any other technical class in years. Thank you for a wonderful class, Mynda!"
Master the Art of Dashboard Creation:
This course is designed to take you from the basics to the advanced features of Excel Dashboards. You'll learn how to:
- Design and Display Principles: Understand what makes a dashboard effective and visually appealing.
- Interactive Controls: Learn how to create interactive elements that allow users to explore data in real-time.
- Advanced Features: Dive into the complexities of dashboards with advanced functionalities.
- Data Analysis: Discover how to analyze data and present it in a compelling narrative.
- Automation: Find out how to set up your dashboard to update automatically, saving you seconds and reducing manual errors.
What You'll Learn:
Impressive Content that Will Provide Insight, Analysis, and Alerts
Dashboards can be a game-changer in various fields such as project management, customer service, retail management, financial forecasting, and beyond. Our course ensures you learn how to:
- Create Dynamic Dashboards: Develop dashboards that are not just static reports but are fully interactive and dynamic.
- Visualize Your Data: Learn to choose the right chart for your dataset and present data in an easily interpretable manner.
- Write Reports: Craft clear, concise, and insightful reports that stakeholders can understand at a glance.
- Maximize Visual Impact: Know which areas of the dashboard should get the most attention and how to make them stand out.
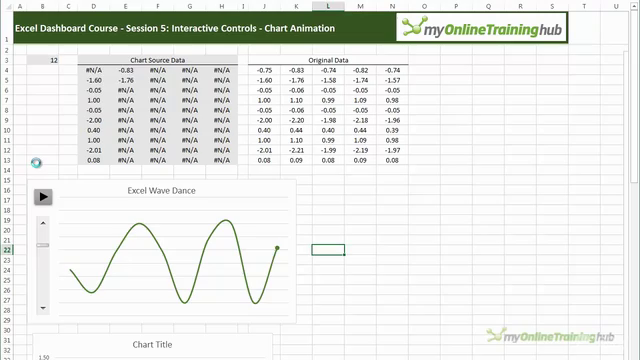
- Use VBA for Animation: Animate charts in your dashboard to create a more engaging experience.
- Interactive Reports: Allow users to filter information and change views within the dashboard.
Prerequisites for Students:
To get the most out of this course, students should have:
- Access to Excel 2007 or later.
- Experience in putting together reports in Excel.
- Knowledge of basic formulas within Excel.
- Familiarity with Pivot Tables and Pivot Charts is helpful but not required.
Course Contents & Overview:
This comprehensive course includes:
- 107 Lectures: Over 11 hours of content that will guide you through every aspect of Excel Dashboards.
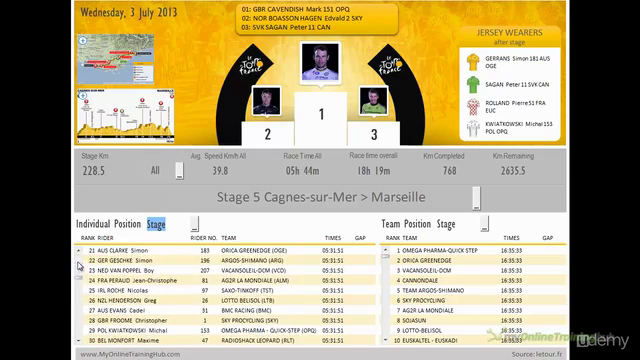
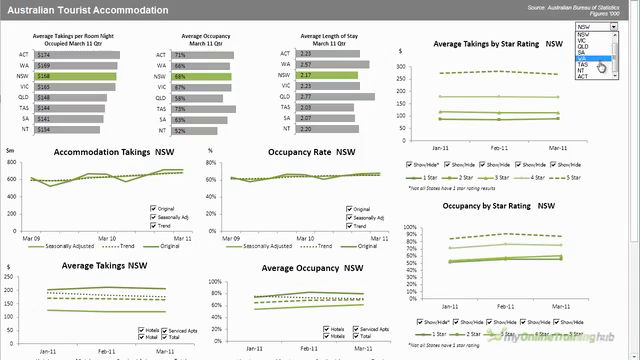
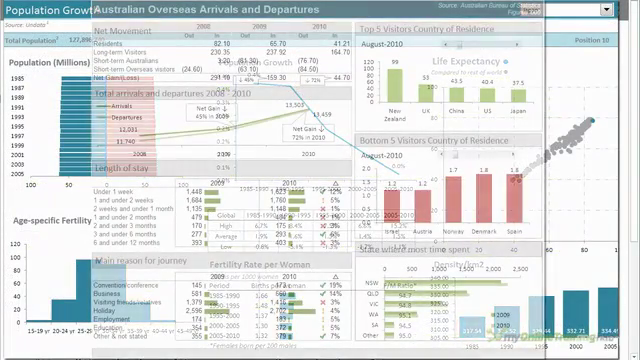
- 5 Sample Excel Dashboards: Real-world examples to provide a working knowledge of visualizing data.
- Optional Supplementary Lessons: An additional 3 hours of tutorials for those who need to brush up on basic concepts (included in the course).
The Impact You'll Make:
Upon completion, you'll know how to:
- Write reports that are both easy to read and interpret.
- Identify the best chart types for your data.
- Decide which parts of the dashboard need to be most attention-grabbing.
- Create dashboards with filters so users can interact with the data.
- Animate charts using VBA, enhancing the storytelling potential of your dashboards.
- And much more!
By mastering these skills, you'll not only stand out in your current role but also open up new career opportunities that leverage the full power of Excel Dashboards. Enroll now and start your journey to becoming an Excel Dashboard expert! 📊🚀
Course Gallery
Loading charts...