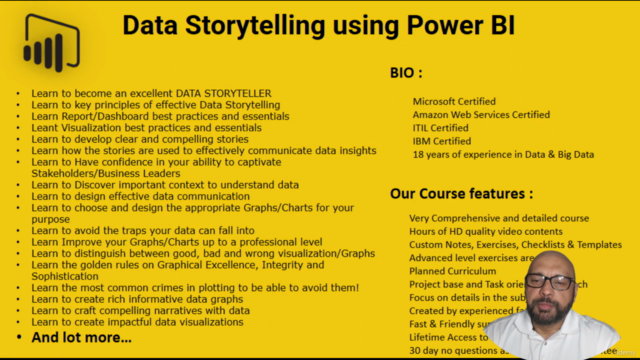
Data Storytelling using Power BI
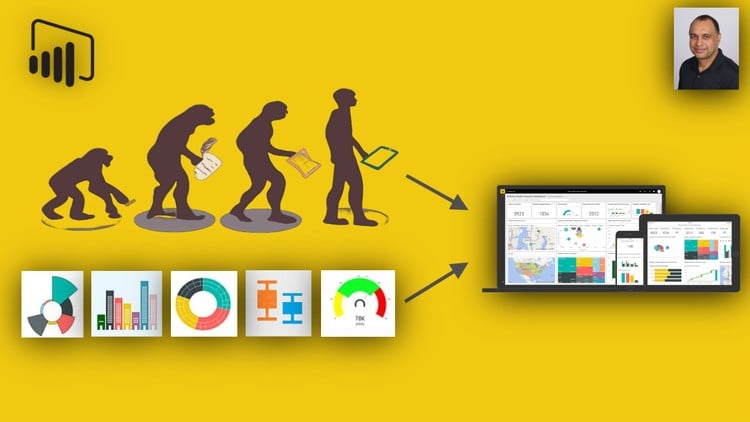
Master the art of effective data storytelling with hands-on projects for Sales, Marketing, IT, HR and other industries.
39
students
20.5 hours
content
Jul 2025
last update
$19.99
regular price
What you will learn
Learn to become an excellent DATA STORYTELLER
Learn to key principles of effective Data Storytelling
Learn Report/Dashboard best practices and essentials
Learn Visualization best practices and essentials
Learn to develop clear and compelling stories
Learn how the stories are used to effectively communicate data insights
Learn to Have confidence in your ability to captivate Stakeholders/Business Leaders
Learn to Discover important context to understand data
Learn to choose and design the appropriate Graphs/Charts for your purpose
Learn to design effective data communication
Learn to avoid the traps your data can fall into
Learn Improve your Graphs/Charts up to a professional level
Learn to distinguish between good, bad and wrong visualization/Graphs
Learn the golden rules on Graphical Excellence, Integrity and Sophistication
Learn the most common crimes in plotting to be able to avoid them!
Learn to create rich informative data graphs
Learn to craft compelling narratives with data
Learn to create impactful data visualizations
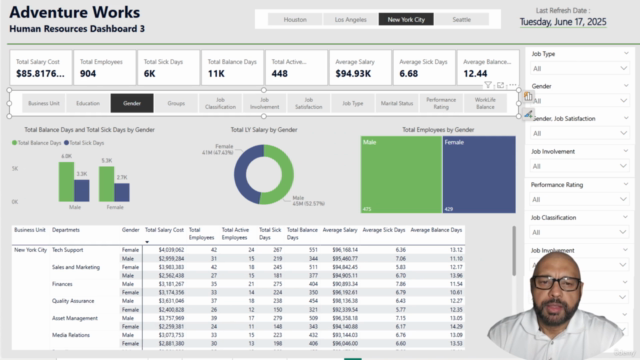
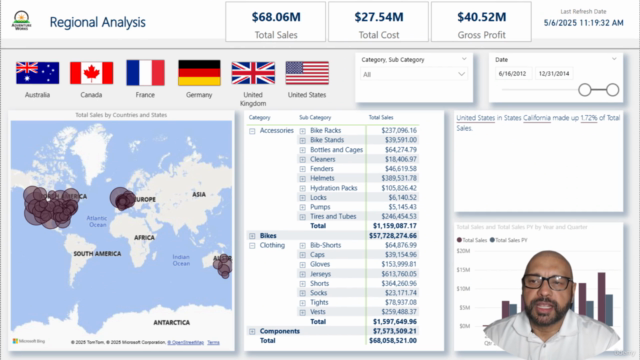
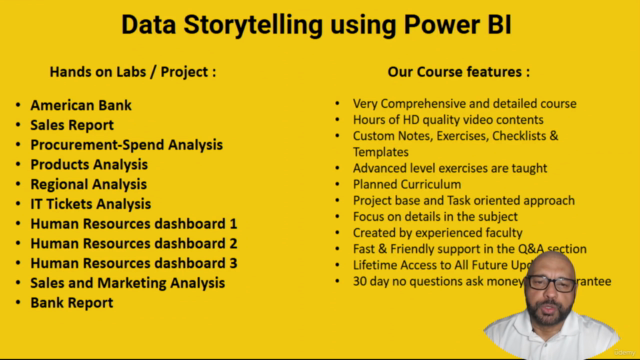
Course Gallery
Loading charts...
6708533
udemy ID
07/07/2025
course created date
12/08/2025
course indexed date
Bot
course submited by