Microsoft Excel: Data Analysis with Excel Pivot Tables

Why take this course?
🎉 Course Title: Microsoft Excel: Data Analysis with Excel Pivot Tables
🚀 Headline: Master Excel Pivot Tables and build data analysis skills with real projects. Learn from a best-selling Excel instructor!
📊 Course Description: Excel Pivot Tables are an absolutely essential tool for anyone working with data in Excel. They allow you to quickly explore and analyze raw data, revealing powerful insights and trends otherwise buried in the noise. In other words, they give you answers—fast, accurate, and intuitive solutions to even the most complicated analytics questions.
This course offers you a deep, 100% comprehensive understanding of Excel Pivot Tables and Pivot Charts. You'll learn when, why, and how to use them, with interactive, hands-on demos and Excel exercises every step of the way. We're not just scratching the surface; we're taking a deep dive into sorting, filtering, grouping, calculated fields, items, and values, all while integrating Pivot Charts, slicers, and timelines to enhance your data visualization capabilities.
📈 What You'll Learn:
- The fundamentals of Excel Pivot Tables
- How to create, analyze, and manage complex data sets
- Advanced techniques for enhancing data insights through Pivot Charts and interactive elements
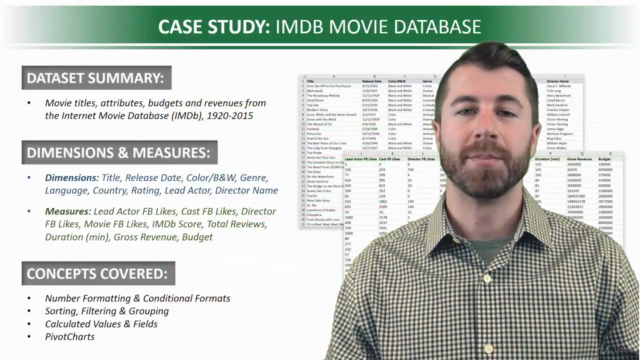
- Real-world applications with hands-on projects
🛠️ Course Features:
- Downloadable resources and project files
- Homework assignments to reinforce learning
- Course quizzes to test your knowledge
- Lifetime access and a 30-day money-back guarantee
- Compatibility with Excel 2007, Excel 2010, Excel 2013, Excel 2016, Excel 2019, or Office 365
🌟 Success Stories: "This is a great Excel course. You can feel confident putting these skills on your resume, and the lectures are in-depth and easy to follow." - Paul M.
"Chris provides clear, detailed explanations and shows how to use Excel Pivot Tables to extract hidden details and facts using raw, real-life data sets in Excel. The quizzes and homework reinforce the lessons and the course layout makes it easy to go back to sections that need revision." - Ernie A.
🏆 Why Choose This Course?
- Taught by a top-rated instructor on Udemy
- Designed for both beginners and advanced users looking to enhance their Excel skills
- A comprehensive approach to data analysis with Pivot Tables in Excel
- Real-life case studies that provide practical experience
👀 Preview What's Inside:
- Introduction to Excel Pivot Tables and their benefits
- Setting up your first Pivot Table and understanding the PivotTable Field List
- Advanced Pivot Table features such as Value Filters, Calculated Fields, and Show Values As
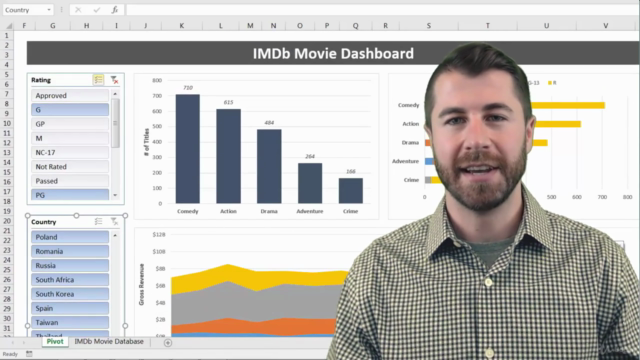
- Data visualization with Pivot Charts and dynamic data storytelling
- Tips for error-proofing and optimizing Pivot Tables for large datasets
📅 Enrollment Details: Start your journey to becoming an Excel analytics pro today! With full course materials, including downloadable resources and project files, you'll have everything you need to succeed. Enroll now and take advantage of lifetime access and our 30-day money-back guarantee.
🤝 Join the Community: Don't just learn Excel Pivot Tables—become a true Pivot Table expert. Enhance your data analysis skills, add a new skill to your resume, and open up exciting career opportunities with the full business intelligence stack from Maven Analytics. Search for "Maven Analytics" to browse our full course library, including Excel, Power BI, MySQL, and Tableau courses!
See you there, and happy analyzing!
-Chris (Founder, Maven Analytics)
Course Gallery


Loading charts...