Data Analysis and Data Visualization with Copilot in Excel
Create and insert Excel formulas, pivot tables, charts etc. and run Python in Excel for advanced analysis using Copilot
4.41 (22 reviews)

3 072
students
1 hour
content
Jun 2025
last update
$19.99
regular price
What you will learn
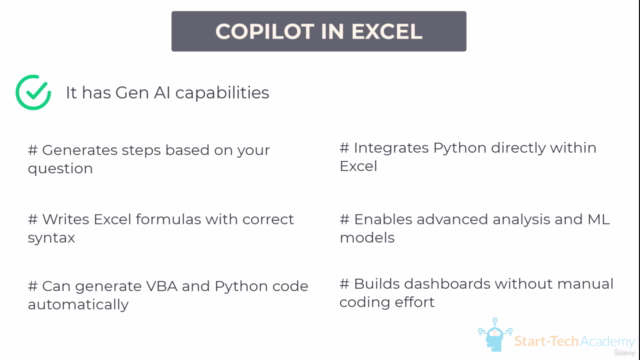
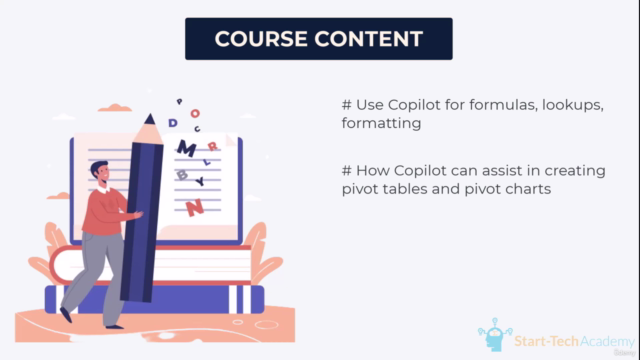
Automate Excel tasks by creating advanced formulas and conditional logic using Copilot
Generate comprehensive Pivot tables and dynamic Pivot charts to simplify data summarization and reporting.
Efficiently organize large datasets by mastering automated sorting, filtering, and conditional formatting
Activate and configure Microsoft Copilot within Excel to optimize your productivity.
Execute predictive analytics directly within Excel using integrated Python scripts facilitated by Copilot.
Conduct detailed text analysis leveraging Python’s natural language processing capabilities within Excel.
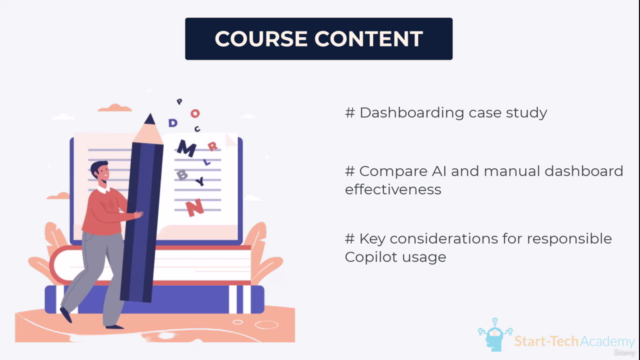
Design and implement interactive dashboards that blend AI-driven insights with Python visualizations for professional reporting.
Evaluate and optimize data visualizations by critically comparing AI-generated charts with manual creations for clearer business communication.
Course Gallery


Loading charts...
6626917
udemy ID
21/05/2025
course created date
05/06/2025
course indexed date
I-Chun Lai
course submited by