Business Analysis with Visually Effective Power BI Reports

Why take this course?
🌟 Transform Your Data into Powerful Insights with "Business Analysis with Visually Effective Power BI Reports" 🌟
Recent Student's Reviews 📚✨
- "It is a great course. Thanks for creating this course." - Rusdha 🚀
- "It was nice when you put 100% concentration into it." - Kurma D. 👌
- "Very Well Detailed Explanation and concepts" - Mustapha M. Y. 📊
- "Easy to understand" - Jessi A. 🤝
- "Learning With Excellent explanation" - Radhakrishnveni A. 🎓
Seven Reasons why you should choose this Business Analysis With Visually Effective Power BI Reports Course 🎯
- Comprehensive Learning: Master various data analysis techniques using Power BI, a critical tool for business intelligence.
- Up-to-Date Content: Benefit from the latest updates and have all your doubts addressed throughout the course.
- Expert Curriculum: Follow a curriculum designed by a proficient Microsoft Power BI expert.
- Efficient Learning Path: Complete this course in a short time span, perfect for busy professionals.
- Real-World Examples: Engage with real-world practical examples and case studies to apply what you learn.
- Practice & Downloadable Materials: Access practical examples and practice exercises from the resource section.
- Verifiable Certificate: Receive a verifiable certificate upon completing the course to add to your professional credentials.
Course Overview 📈💻
This course covers essential areas such as:
- Business Analysis
- Power BI Reports
- Data Visualization
- Business Intelligence
- Analytics & Data Analysis
- Visual Reporting
- Decision Support
- Dashboards
- Data Interpretation
- Business Insights
- Data-driven Decision Making
- Power BI Tools
- Business Reporting Techniques.
Hands-On Projects 🛠️📊
-
Project 01 - Mubeen Food Corner's Sales Analysis Report - 2022
- Mubeen Total Profit Analysis Report - 2022
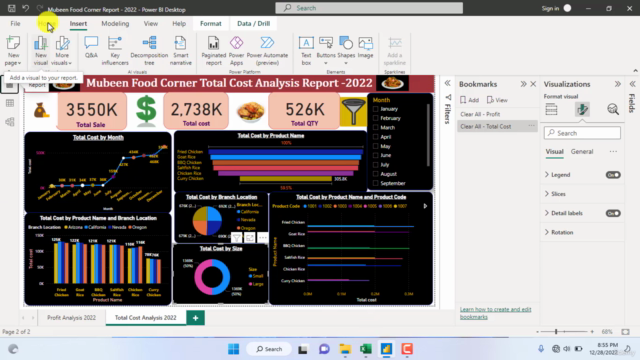
- Mubeen Total Cost Analysis Report - 2022
-
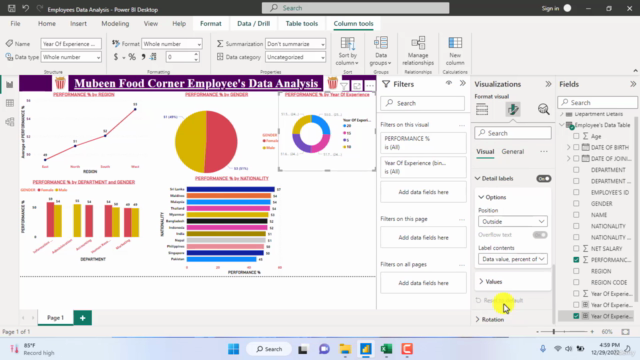
Project 02 - Mubeen Food Corners Employees' Data Analysis Report
- Employee's Performance Analysis Report
-
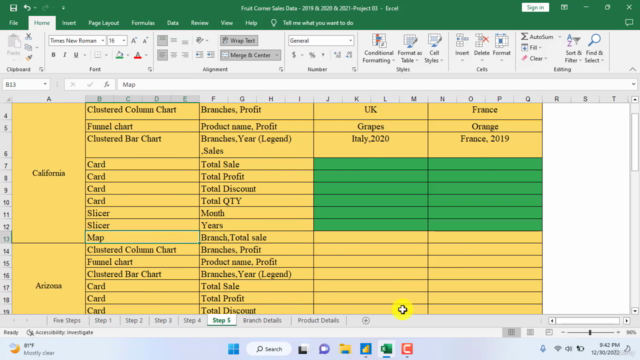
Project 03 - Nama Cool Fruit's Corner's Sales Analysis Report for the years of 2019,2020 and 2021
- All Branch Sale's Analysis Report
- Branch wise Sale's Analysis Report (UK, USA, Italy, and France)
-
Project 04 - Website based Data analysis Report
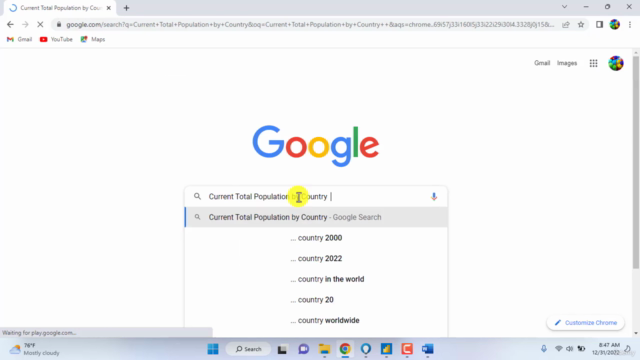
- World Total Population by country Related Data Analysis Report
Key Section of the Course 🔑📈
The course is structured to provide a hands-on learning experience with four key projects, each designed to give you practical exposure to different aspects and data sets. These real-world scenarios will not only enhance your understanding of Power BI but also sharpen your analytical skills.
Enroll Now & Start Your Journey 🚀
Go ahead and click the enroll button, and I'll see you in Chapter 1! This course is the perfect step if you're new to Power BI or looking to deepen your understanding of this powerful tool. Let's embark on a journey to transform raw data into compelling reports that will inform critical business decisions.
Cheers 🍻 A.M.A.M.Mubeen 👨💻
Course Gallery
Loading charts...