Become Expert on Grafana Dashboard

Why take this course?
🌟 Become a Grafana Dashboard Expert with Ease! 🌟
Course Title:
Become Expert on Grafana Dashboard 🚀
Course Headline:
Easy Learning, Building Great Dashboard using Grafana 6.4 and 7.0 📚✨
Welcome to the comprehensive journey of mastering Grafana Dashboards! This course is meticulously designed for anyone aspiring to become a Grafana Administrator or simply looking to gain a solid understanding of Grafana. Whether you're a beginner or seeking to deepen your existing knowledge, this course promises to guide you through with clear, step-by-step video tutorials tailored for easy comprehension.
What You'll Learn:
- 📬 Install Grafana on both CentOS 7 and Ubuntu 16.04 to get started with the platform on your preferred operating system.
- 🔗 Integrate Grafana with Zabbix and MySQL data sources, demystifying their structure and enhancing your data visualization skills.
- 🛠️ Build a High Availability (HA) setup using MariaDB database for robust and reliable dashboarding.
- 🔒 Configure Grafana security measures to keep your dashboards safe and secure.
- 📊 Create dynamic dashboards with multiple panels and items, transforming raw data into actionable insights.
- 🎫 Utilize Grafana regular expressions to filter data efficiently across multiple items.
- ✍️ Add annotations to your graphs, highlighting critical data points for clearer analysis.
- 🛠️ Manage Grafana plugins, learning how to install and remove them as needed.
- 🌍 Export/import dashboard templates with ease, making your dashboards portable and shareable.
- 🔗 Integrate FreeIPA LDAP for an even more powerful user management experience.
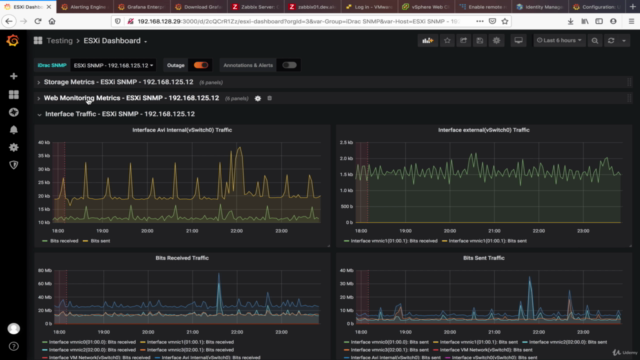
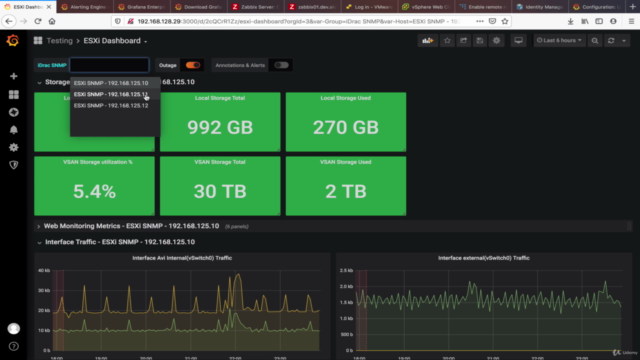
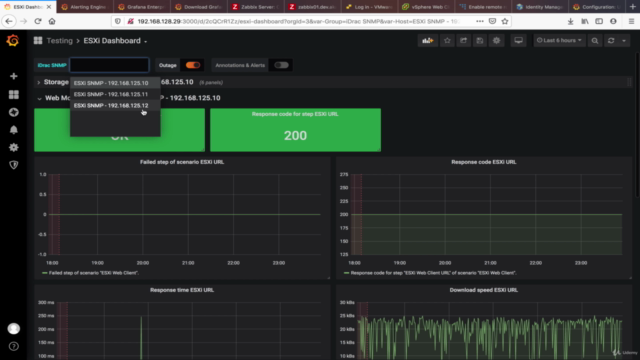
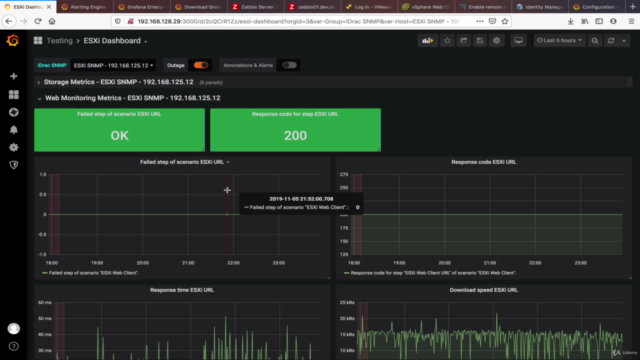
- 🏆 Build specialized dashboards for VMWare ESXi, VMs, VSAN, HAProxy, and more, with step-by-step guidance.
- ...and much more!
Course Breakdown:
This course is structured into 15 sections with 65 lectures, totaling 7 hours 11 minutes of content. The majority of the videos are hands-on tutorials that will have you configuring and building Grafana dashboards from scratch.
Panel Mastery:
Gain expertise in a wide array of Grafana panels, including but not limited to:
- Clock panel
- Graph panel
- Single Stat panel (with math capabilities)
- Blend Stat panel
- Table panel
- Gauge panel
- Bar Gauge panel
- Pie Chart panel
- Heatmap panel
- Text panel
- Trend Box panel
- Diagram panel (and many others)
Dashboard Templates Included:
You will also receive Grafana dashboard templates for various use cases, such as:
- ESXi Dashboard template
- VMWare VM Dashboard template
- VSAN Dashboard template with API script
- Cisco Switch Dashboard template
- MariaDB/MySQL Dashboard template
- Server Linux Dashboard template
- Events/Alerts List Dashboard template
- HAProxy Dashboard template (and many others)
Your Expert Instructor:
This course is led by Muhammad Yusuf Efendi, a Zabbix Certified Professional with extensive experience in IT and Cloud technologies. His expertise ensures that you will not only learn the practical aspects of Grafana but also gain insights into best practices for deployment, management, and visualization.
Join the Community of Experts!
Embark on your journey to becoming a Grafana Dashboard Expert today. If you have any questions or need assistance while following this course, don't hesitate to reach out to Muhammad Yusuf Efendi for support.
Thanks for choosing this comprehensive course to master Grafana Dashboards! 📈🚀
Note: The information provided here is a summary of the course content as outlined by the instructor. For full details and to enroll, please visit the official course page or contact Muhammad Yusuf Efendi directly.
Course Gallery


Loading charts...