Become a Data Analyst: Excel, SQL & Tableau - 3-in-1 Bundle
Why take this course?
🎓 [April 2024 Update]
🛠️ What's New?
- ✅ A new video on analyzing data with MS Excel's "Analyze Data" feature.
- ✅ An engaging section on practicing SQL using real-world case studies.
- ✅ A step-by-step guide on integrating ChatGPT within Excel using the openAI API.
- ✅ An in-depth video on understanding how indexes work in SQL queries.
🚀 Transform Your Career with Data Analytics!
Welcome to the "Become a Data Analyst: Excel, SQL & Tableau - 3-in-1 Bundle" course – your gateway to mastering the tools essential for data analysis and turning raw data into actionable business insights.
🔍 Course Highlights:
- 📊 Develop advanced skills in Excel for manipulating and analyzing data.
- 🔢 Master SQL queries to efficiently extract and manage data from databases.
- ✨ Create compelling, insightful data visualizations with Tableau.
💪 Why This Course?
This course stands out due to its comprehensive approach, offering a seamless blend of theoretical knowledge and practical application through real-world examples and hands-on exercises. It's crafted by industry experts, Abhishek (MBA - FMS Delhi, B. Tech - IIT Roorkee) and Pukhraj (MBA - IIM Ahmedabad, B. Tech - IIT Roorkee), who bring years of experience in Global Analytics Consulting.
🎉 Student Testimonials:
- "This course is fantastic! The explanations are clear even for a layman." – Joshua
- "I can't express how thankful I am for this course. It's worth every penny!" – Daisy
📖 Course Overview:
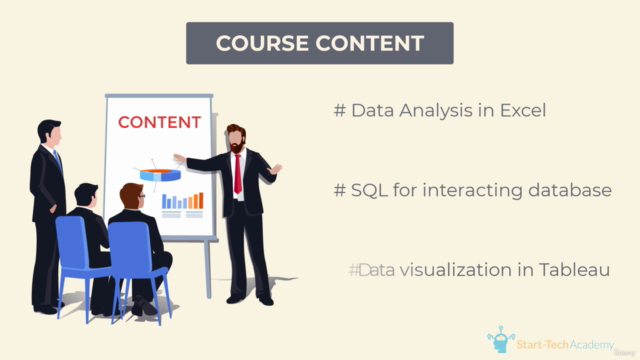
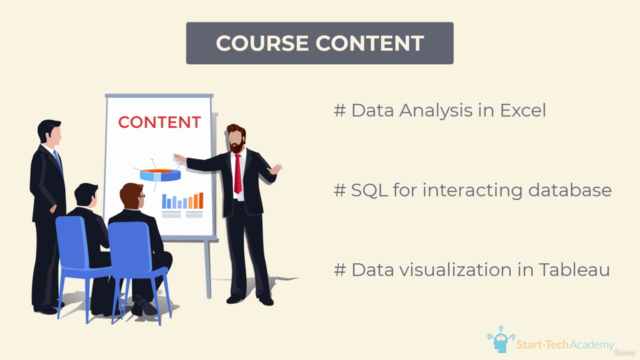
The course is meticulously structured to cover the three most powerful analytics tools: MS Excel, SQL, and Tableau. Here's what you can expect:
Part 1 - Excel for Data Analytics:
- Learn essential data manipulation techniques in Excel.
- Master data visualization to uncover hidden patterns within your datasets.
Part 2 - SQL for Data Analytics:
- Get started with the basics of SQL and progress to advanced topics like subqueries, joins, data aggregation, and pattern matching.
Part 3 - Data Visualization using Tableau:
- Explore the world of data storytelling by creating interactive dashboards and visualizations in Tableau.
- Learn how to blend data, perform calculations, and leverage mapping features to gain deeper insights.
🤝 Our Promise to You:
Your learning experience is our top priority. If you have any questions or need clarification on course content, practice sheets, or any topic, we're here to help. Reach out through the course platform or send us a direct message – we're committed to ensuring your success.
🌟 Don't Miss Out!
Embark on your journey towards becoming a proficient data analyst. Enroll in this comprehensive, hands-on course today and unlock the power of data analytics! 🌟
Course Gallery
Loading charts...