Google Data Studio Course 2022- From Beginner To Advanced

Why take this course?
🌟 Google Data Studio Course 2022: From Beginner To Advanced 🌟
Course Title: Learn how to create interactive reports, dashboards, and perform data analysis with Google Data Studio for your Google Sheets.
Harness the Power of Data Visualization with Google Data Studio!
Course Description:
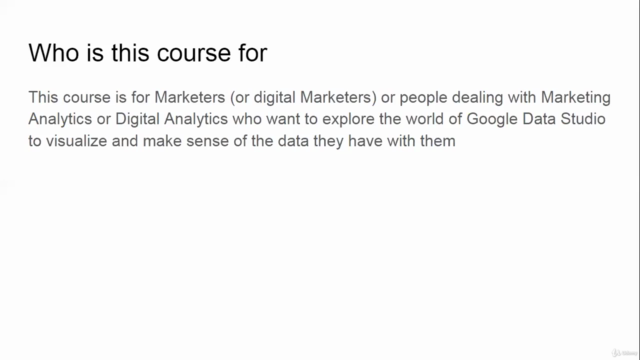
Google Data Studio is a versatile and robust tool that empowers users to transform data into compelling visual narratives. In this comprehensive course, you'll embark on a journey from a beginner to an advanced user of Google Data Studio. Tailored for individuals looking to leverage their Google Sheets data, this course will guide you through the entire process - from connecting your data sources to creating sophisticated dashboards that tell your data’s story in an engaging and insightful manner.
What You'll Learn:
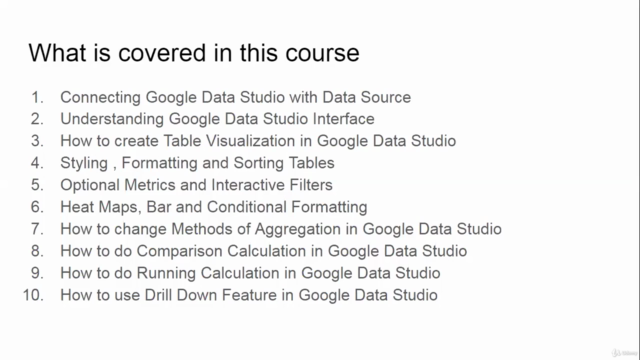
- 🔗 Connecting Google Data Studio with Data Sources: Start by linking various data sources to Google Data Studio effortlessly.
- 🤔 Understanding Google Data Studio Interface: Familiarize yourself with the interface and its components, making navigation a breeze.
- 📋 Table Visualization: Learn to create interactive tables that display your data clearly and effectively.
- ✨ Styling, Formatting, and Sorting Tables: Master the art of enhancing your tables for better readability and impact.
- 🛠️ Optional Metrics and Interactive Filters: Discover how to add context with optional metrics and make your reports interactive with filters.
- 🔥 Heat Maps, Bar, and Conditional Formatting: Visualize data in a dynamic way using heat maps, bar charts, and conditional formatting.
- 🔄 Changing Methods of Aggregation: Understand different methods to aggregate your data for meaningful insights.
- ⚫️ Comparison Calculations: Learn techniques to compare sets of data within Google Data Studio.
- 🏃♂️ Running Calculations: Perform running calculations to track changes over time.
- 📊 Drill Down Feature: Utilize the drill-down feature to delve deeper into your data.
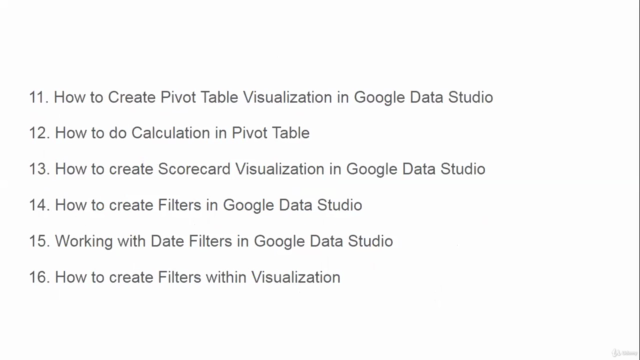
- ↕️ Pivot Table Visualization: Create pivot tables for a multi-dimensional view of your data.
- 🎯 Calculations in Pivot Tables: Learn how to perform complex calculations within your pivot table visualizations.
- 📈 Scorecard Visualization: Create scorecards to track and compare performance metrics.
- 🔍 Creating Filters: Understand how to create filters to refine the data presented in your reports.
- 🗓️ Working with Date Filters: Work effectively with date filters to manage time-based data.
- 📈 Custom Filters Within Visualization: Learn to set filters directly within visualizations for more granular control.
- 🧮 Calculations in Google Data Studio: Perform various calculations directly within your dashboards.
- 🔄 Case Statement Usage: Utilize the CASE statement to manipulate your data for better insights.
- 🕰️ Time Series Visualization: Analyze time-based data with powerful time series graphs.
- 🌱 Area Graphs and Column Chart Creation: Create area graphs and column charts to visualize different types of data.
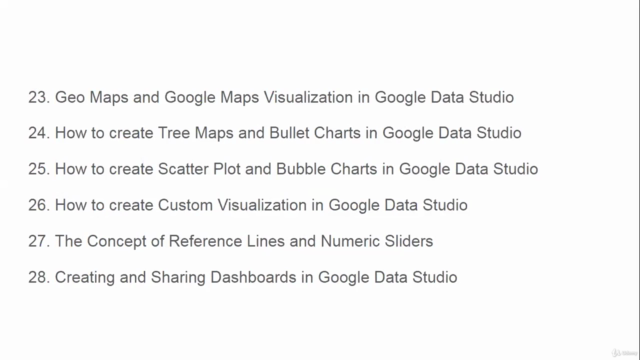
- 🌍 Geo Maps and Google Maps Integration: Plot geographical data on maps for a global perspective.
- 🌲 Tree Maps and Bullet Charts: Learn to create tree maps for hierarchical data representation and bullet charts for performance tracking.
- 🔮 Scatter Plot and Bubble Charts: Visualize complex relationships with scatter plots and bubble charts.
- 🚀 Custom Visualization Development: Go beyond the built-in visualizations by creating your own custom visualizations.
- 📊 Reference Lines and Numeric Sliders: Enhance your visualizations with reference lines and numeric sliders for context and interactivity.
- 🔄 Dashboard Creation and Sharing: Design and share compelling dashboards with your audience.
- 🔄 Data Blending: Combine data from multiple sources to create comprehensive reports.
- 🗝️ Working with Blended Data: Learn how to work effectively with blended data for a holistic view of your information.
- 🔍 Using Extract Data and Data Explorer Features: Utilize these features to extract meaningful insights from your data.
Why Take This Course?
- Practical Skills: Gain hands-on experience with Google Data Studio through real-world examples.
- Versatile Tool Mastery: Command a wide array of visualizations and techniques to make data analysis approachable for everyone.
- Data Storytelling: Learn how to turn dry data into engaging narratives that drive action and decision-making.
- Community Access: Join a community of like-minded professionals who are passionate about data analysis and visualization.
Embark on your journey to becoming a data visualization expert today! 📊✨
Course Gallery


Loading charts...