Excel: Data Analysis with Pivot Tables

Why take this course?
📊 Unlock the Full Potential of Your Data with Excel: Data Analysis with Pivot Tables 🚀
Course Description:
Are you ready to elevate your data analysis skills in Excel to new heights? With the "Excel: Data Analysis with Pivot Tables" course, you'll learn how to master the art of PivotTables and transform your raw data into actionable insights. This comprehensive online course is designed for intermediate Excel users who want to refine their skills and harness the full potential of this powerful tool.
Course Instructor: Kathy Jones 🏆 Kathy Jones, a Microsoft certified trainer with years of experience, brings her expertise directly to you. She will guide you through every aspect of PivotTable creation, formatting, and manipulation, ensuring you get the most out of your data analysis in Excel.
What You'll Learn:
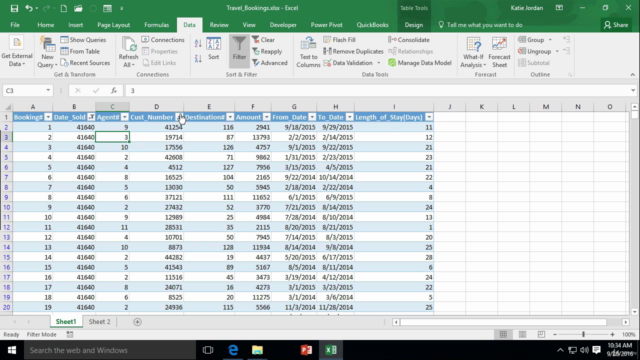
- Preparing Data for Analysis: Learn how to set up and organize your data effectively before creating a Pivot Table.
- Creating Pivot Tables: Discover how to create Pivot Tables from local, multiple local, and external data sources, enhancing your ability to handle different types of datasets.
- Data Summarization & Visualization: Understand how to summarize, organize, filter, and format your Pivot Table data for better insights.
- Advanced PivotTable Options: Gain the knowledge to refresh Pivot Table data and modify its options to suit your specific needs.
- Pivot Chart Creation: Learn to create compelling Pivot Charts that can visualize your data in a more understandable and impactful way.
Course Content & Style: Our engaging HD content is presented in Bigger Brain's Teacher-Learner style, ensuring you get the most out of each lesson. With clear explanations, hands-on demonstrations, and interactive examples, you'll learn more effectively and retain your new skills longer.
Hands-On Learning Objectives: By the end of this course, you will be able to:
- Create Pivot Tables from various data sources, including local files, multiple local data sources, and external databases.
- Organize, sort, filter, and format your Pivot Table data to highlight key insights.
- Modify PivotTable options for customized data analysis.
- Develop and adjust Pivot Charts to complement your Pivot Table findings.
Why Take This Course?
- Actionable Insight: Gain the skills to extract meaningful results from your data with Excel's powerful PivotTable feature.
- Expert Guidance: Learn from a Microsoft certified expert who can provide real-world examples and answer your questions.
- Versatility in Learning: Whether you're working with financial reports, market analysis, or any large dataset, this course equips you with the tools to analyze and present data like never before.
Who Should Take This Course? This course is ideal for intermediate Excel users who are looking to enhance their skills and learn advanced PivotTable tools and functions. Whether you're in finance, marketing, business analytics, or any field that requires data analysis, these skills will be invaluable to your success.
Join us today and turn your raw data into a story that speaks volumes. With Excel: Data Analysis with Pivot Tables, you'll not only analyze data but also interpret it with confidence and clarity. Let's make your data work for you! 📈🎉
Enroll now and step into the world of advanced data analysis with Excel! 🚀
Course Gallery


Loading charts...