Excel - Creating Dashboards

Why take this course?
🌟 Course Title: Excel - Creating Dashboards: Top Tips for Querying and Displaying Information 🚀
Headline: Unlock the power of data with advanced Excel features! 📊✨
Get more from Excel and learn to use Forms, Lookup Functions, Charts, PivotTables, and Slicers to turn data into answers.
Are you ready to elevate your data analysis skills? Dive deep into the world of advanced Excel features and transform your raw data into insightful dashboards that make reporting and decision-making a breeze. This comprehensive course is designed for learners who are comfortable with the basics and are looking to push their capabilities further.
What You'll Learn:
Topics covered include:
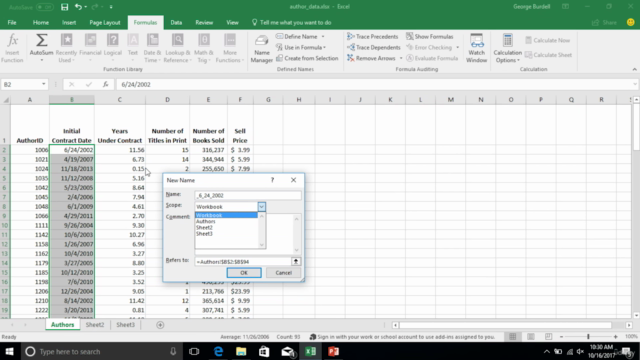
- Using Range Names in Formulas: Streamline your formulas for greater efficiency and accuracy.
- Creating Nested Functions: Master the art of combining functions within functions to handle more complex data scenarios.
- Working with Forms, Form Controls, and Data Validation: Enhance your user interface and ensure data integrity with interactive Excel forms.
- Using Lookup Functions: Find exactly what you need with powerful lookup tools like VLOOKUP and HLOOKUP.
- Combining Multiple Functions: Learn how to merge various functions to perform complex calculations with ease.
- Creating, Modifying, and Formatting Charts: Visualize your data effectively with charts that pop and provide clear insights.
- Using Sparklines, Trendlines, and Dual-Axis Charts: Complement your charts with mini-charts (sparklines) and understand trends with trendlines; explore the capabilities of dual-axis charts for more nuanced comparisons.
- Creating a Pivot Table and Analyzing Pivot Table Data: Summarize large datasets quickly, and drill down into the details when needed.
- Presenting Data with Pivot Charts: Bring your Pivot Tables to life with dynamic visualizations that highlight key trends and patterns.
- Filtering Data with Slicers: Manage complex data sets with interactive filters that let you focus on specific data ranges in an instant.
Why Take This Course?
Over 2 hours of high-quality HD content in the “Uniquely Engaging”TM Bigger Brains Teacher-Learner style!
Join Microsoft Certified Trainer Barbara Evers as she guides you through these essential Excel topics and tools. By the end of this course, you'll be equipped with the knowledge to:
Enhance Your Data Skills Today! 📈
Take the next step in your Excel proficiency and become a data analysis hero. Whether you're an aspiring data analyst, a business professional looking to improve reporting capabilities, or simply someone who wants to master Excel, this course is the perfect toolkit for your success. 🚀
Sign up now and transform your data into stories that matter!
Course Gallery


Loading charts...