Wrangling Major League Baseball Pitchf/x Data with Python

Why take this course?
_Course Title: Charting MLB GameDay - PitchF/x Data using Jupyter Notebooks, Python, and MatPlotLib
Headline: Dive into the World of SaberMetrics with Chaz Henry: Analyzing Clayton Kershaw's 2014 No-Hitter via MLB PitchF/x Data! 🎯⚫️✨
Course Description:
Unlock the Secrets of Baseball Analytics with Python
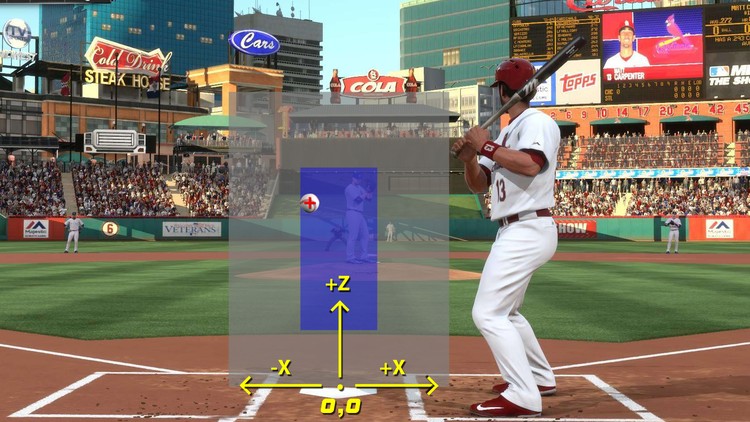
🚀 Background: In 2006, Major League Baseball introduced PitchF/x, a revolutionary pitch tracking camera system. Now an integral part of every MLB game, this technology has evolved into what we know today as GameDay – tracking every pitch's trajectory and player movement with unparalleled precision. The data it generates are a goldmine for analysts and teams alike, shaping strategies and revealing hidden talents.
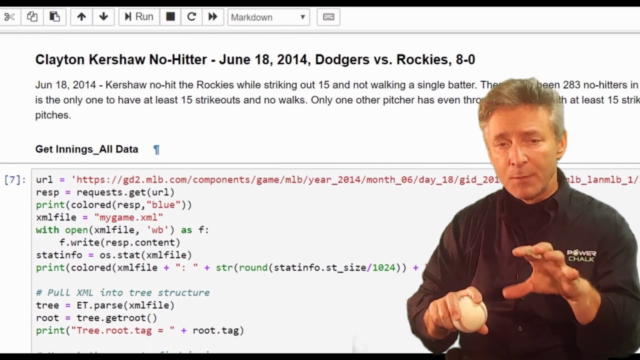
🧠 Data at Your Fingertips: The MLB makes this trove of data available to the public, inviting SaberMetricians to delve into the intricacies of every pitch thrown in a game. This course leverages real-life data from Clayton Kershaw's historic 2014 no-hitter to demonstrate how you can analyze and visualize this rich dataset.
👩💻 Course Overview: As a software engineer and seasoned little league coach, I, Chaz Henry, will guide you through the process of harnessing the power of Python within a Jupyter Notebook to wrangle MLB PitchF/x data. This course is your gateway to understanding SaberMetrics – the empirical study of baseball statistics – and its role in modern baseball analysis.
📚 What You'll Learn:
- Jupyter Notebook Basics: We'll kick off by familiarizing ourselves with Jupyter Notebook, an open-source web application that allows you to create and share documents that contain live code, equations, visualizations, and narrative text.
- Python for Data Wrangling: You'll learn Python best practices tailored for data analysis, including data extraction, cleaning, and manipulation.
- XML Parsing in Python: We'll navigate through XML structures to extract the PitchF/x data you need.
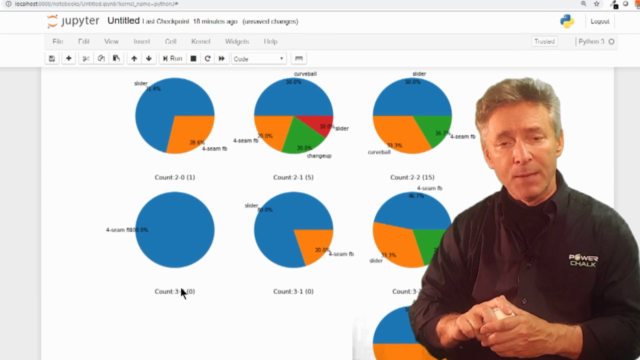
- Data Visualization with MatPlotLib & PyPlot: Transform raw data into compelling visual stories using these powerful libraries to graph pitches, pitch types, and velocities.
- Best Practices in Data Analysis: From selecting the right tools to interpreting the results, we'll cover the do's and don'ts in analyzing baseball data.
📈 Who This Course Is For:
- Coders: If you're a programmer looking to expand your skills into data analysis and visualization, this course is for you.
- SaberMetricians: Fans and analysts who are passionate about the empirical study of baseball statistics will find this course enlightening.
- Baseball Enthusiasts: Whether you're a coach, player, or just a baseball fan with an interest in analytics, this course will provide you with insights into what drives modern baseball strategies.
🏆 Final Project: Your final project will involve scrubbing and analyzing the pitch data from one of the greatest pitching performances in MLB history – Clayton Kershaw's 2014 no-hitter. You'll use Python to clean, visualize, and present your findings.
Join me, Chaz Henry, on this journey into the world of baseball data analytics, and let's turn the data behind MLB's greatest performances into actionable insights using Python and Jupyter Notebooks! 🏆⚾️🔍
What Are You Waiting For?
Enroll now to start your journey into the world of baseball analytics and data visualization with Python. Let's decode the secrets of MLB pitching performance together! 🚀➡️🎓🎉
Course Gallery


Loading charts...