Visualize Data Using Grafana

Why take this course?
📊 Master Data Visualization with Grafana: A Comprehensive Online Course
Course Headline: Unlock the power of your data with our comprehensive course designed to master data visualization and analysis using Grafana's intuitive dashboard and panels.
🚀 Course Title: Visualize Data Using Grafana
Course Description:
Are you ready to transform raw data into compelling visual stories? In the world of business intelligence, data is king, but its true potential unfolds only when it's visualized effectively. That's where Grafana shines as a robust and versatile tool for creating beautiful and insightful dashboards.
🔥 Why Learn Grafana?
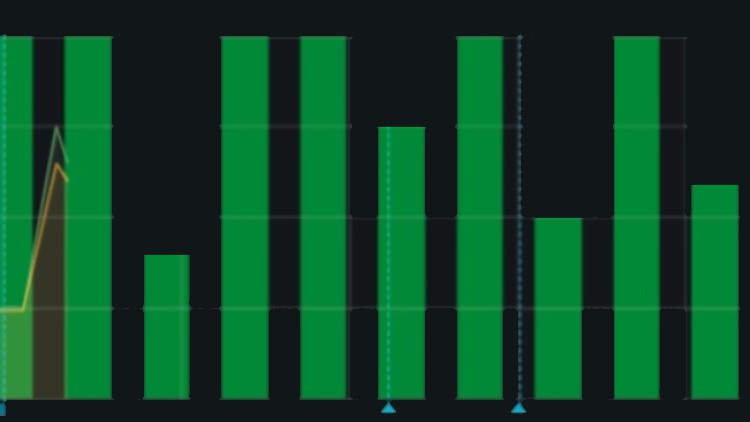
- Engaging Visualization: Bring your data to life with a variety of charts, graphs, and visual representations.
- Intuitive User Experience: Design user-friendly dashboards that offer an at-a-glance overview of critical metrics.
- Real-time Analysis: Monitor performance in real time, allowing for swift decision-making based on live data.
- Customizable Panels: Tailor your visualizations to suit your specific needs, from gauge charts to heatmaps and beyond.
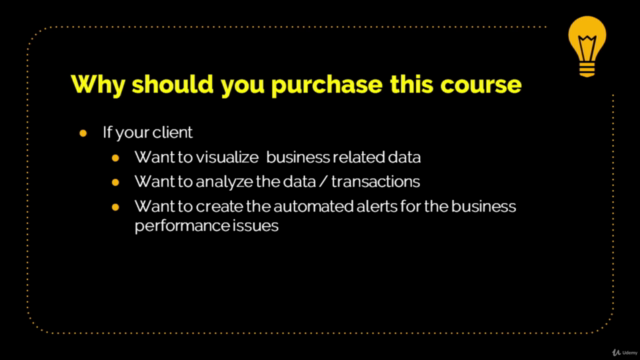
- Automated Alerts: Set up alerts to stay ahead of issues, ensuring immediate action when anomalies are detected.
🌍 Course Highlights:
- 🔍 Understanding Dashboards: Learn how to create and customize dashboards that provide a clear, comprehensive overview of your data.
- 📈 Exploring Panels: Discover the different types of panels available in Grafana and when to use each type for maximum impact.
- 🛠️ Advanced Data Visualization Techniques: Master the art of creating various charts, including gauge, heatmap, and more, to represent your data effectively.
- 🚫 Error Detection: Understand how to set up automated alerts and notifications to keep stakeholders informed about system health and performance issues.
- 👥 User Management: Learn how to manage user accounts, teams, and permissions within Grafana for a secure and efficient data environment.
🚀 What You Will Learn:
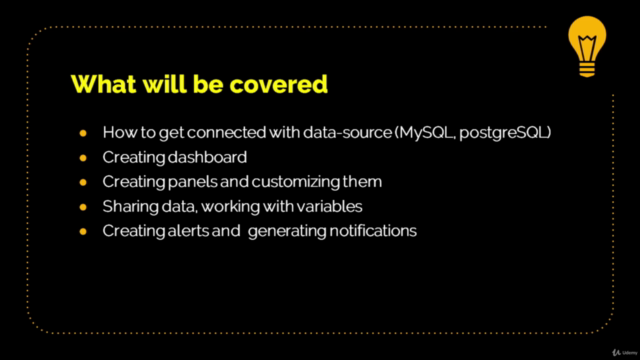
- How to connect various data sources with Grafana.
- Techniques to create visually appealing dashboards that are both informative and interactive.
- Strategies for setting up alerts and notifications for proactive monitoring and troubleshooting.
- Best practices for user, team, and permission management within your Grafana instance.
- Tips for optimizing the performance of your dashboards and panels.
👩🏫 Course Format: This self-paced course is designed to cater to both novice and experienced users. Through a series of video tutorials, interactive exercises, and real-world examples, you'll gain hands-on experience that will solidify your understanding of Grafana.
🎓 Who Should Take This Course?
- Data Analysts
- Business Intelligence Professionals
- System Administrators
- DevOps Engineers
- IT Professionals
- Anyone interested in data visualization and real-time monitoring systems
By the end of this course, you'll have the skills and knowledge to not just view your data, but to bring it to life with Grafana. 🌟
Enroll now to embark on a journey to become a Grafana guru and transform your data into actionable insights!
Course Gallery


Loading charts...