Visualization and Imputation of Missing Data
Why take this course?
🎓 Course Title: Visualization and Imputation of Missing Data
Course Headline:
Unlock the Secrets of Your Data: Master Visualization and Imputation Techniques for Non-Multivariate-Normal Data Sets
Course Description:
Understanding and analyzing data sets with missing values can be a significant challenge. The "Visualization and Imputation of Missing Data" course, led by Geoffrey Hubona, Ph.D., provides a comprehensive approach to tackle this issue head-on. This course is designed to help you grasp the intricacies of 'missingness' patterns, particularly in non-multivariate-normal data sets, and equip you with the necessary tools to impute missing data accurately.
With a focus on visualization, you will learn to leverage the VIM and VIMGUI packages in R to create a diverse array of visualizations. These tools are instrumental in uncovering hidden patterns within your data, both before and after imputation. The course delves into various imputation techniques suitable for non-normal data, including:
- Hot-Deck Imputation: Learn about the sequential and random hot-deck algorithm, which replaces missing values using similar cases.
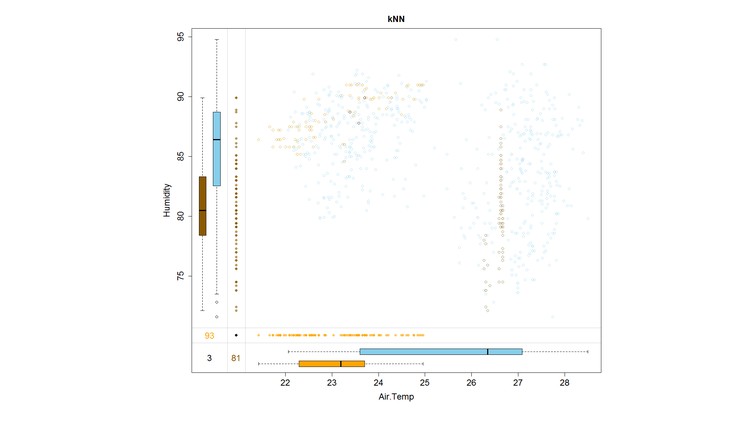
- k-Nearest Neighbor Imputation: Understand how to use distance-based methods to estimate missing values based on the nearest neighbors in the data.
- Regression-Based Imputation: Discover how individual records can be imputed using regression models.
- Iterative, Model-Based Imputation: Get hands-on experience with the iterative regression imputation technique, including both standard and robust methods like the IRMI algorithm.
Throughout the course, you'll recognize and interpret missing data patterns via engaging visualizations provided by the professional VIMGUI software. This will enable you to make informed decisions on how best to address missing data in your own datasets.
Who Should Take This Course?
This course is an invaluable resource for anyone involved in empirical research or data analysis who encounters missing data, including:
- Graduate Students: Enhance your analytical toolkit and ensure your research is robust against data anomalies.
- Academic Faculty: Strengthen your ability to handle complex datasets in your research endeavors.
- Working Professionals: Improve the accuracy of your data analysis across various fields such as economics, social sciences, biomedical research, and beyond.
Key Takeaways:
- A deep understanding of missing data patterns and their implications for your data.
- Expertise in applying state-of-the-art imputation techniques tailored for non-multivariate-normal datasets.
- Proficiency in using R's VIM and VIMGUI packages to visualize and interpret missing data effectively.
Note on Software Compatibility: The course materials include Geoffrey Hubona's own VIMGUI toolbar, developed in the RGtk2 visualization programming language in R. While this toolbar is compatible with most systems, there may be initial startup issues on Mac computers. Users are encouraged to explore alternative approaches or seek support from the course community if faced with these challenges.
Course Highlights:
- Comprehensive Curriculum: Tailored for understanding and handling missing data in non-multivariate-normal datasets.
- Hands-On Learning: Practical experience with imputation techniques and visualization tools.
- Professional Software: Access to VIMGUI software for creating compelling visualizations of your data.
- Expert Guidance: Learn from Geoffrey Hubona, Ph.D., a recognized expert in the field of data visualization and imputation.
Ready to transform your approach to analyzing datasets with missing data? Enroll in this course today and take the first step towards becoming a data analysis pro! 🚀📊✨
Course Gallery
Loading charts...