Visual Charts for Business Insights and Improvements
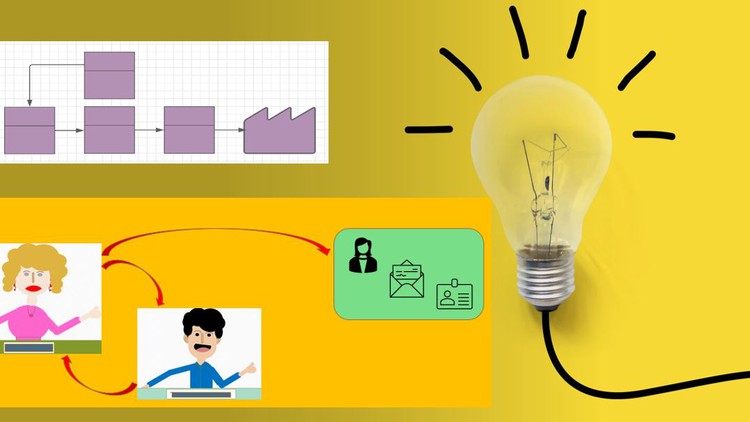
Why take this course?
Visual Charts for Business Insights and Improvement: Continuously Improve Your Business and Delight Your Customers
Course Description:
Are you looking to transform your business acumen and elevate the way you analyze and present data? Whether you're a seasoned leader, a burgeoning entrepreneur, or a member of an administrative, operations, HR, product design, development, manufacturing, distribution, or marketing team, this course is your gateway to unlocking the power of visual charts for profound business insights and improvements.
🎓 Who Is This Course For?
- Aspiring entrepreneurs who want to kickstart their small business with data-driven decisions.
- Current business owners aiming to scale up and refine their operations.
- Professionals in any department looking to enhance decision-making processes through better insights.
- Individuals eager to sharpen their business agility, process management, and analytics capabilities.
Why Enroll? This course is more than just an educational experience; it's a transformation journey for your business intelligence. You'll dive into the world of visual charts, learning not only how to create them but also how to interpret the data to make strategic decisions that will propel your business forward.
📊 Key Learning Outcomes:
- Understanding Business Insights: Learn what makes a great visual chart for business and the various types of charts that can provide you with critical insights.
- Skill Mastery: Step-by-step guidance on creating, customizing, and applying visual charts in real-world business scenarios.
- Strategic Tools & Techniques: Access to a variety of tools and methods for designing visual charts that will make your data analysis stand out.
- Practical Application: Explore case studies from different organizational functions to understand how visual charts can be used across the company spectrum, from HR to sales.
- Data Interpretation & Decision Making: Gain confidence in interpreting chart data and making informed business decisions that will delight your customers.
Course Highlights:
- Interactive Learning: Engage with interactive content that makes learning about visual charts both enjoyable and effective.
- Real-World Applications: See how visual charts can be applied within various departments of an organization, from planning to execution.
- Expert Instruction: Learn from the expertise of Johanna Rusly, a seasoned instructor with practical experience in leveraging data for business success.
- Versatile Tools: Get familiar with the tools you'll use to create visual charts and learn which one fits your unique needs.
- Continuous Improvement: Understand how visual charts contribute to continuous improvement efforts within your organization.
What Will You Achieve? Upon completion of this course, you will have:
- A robust understanding of how visual charts can provide actionable business insights.
- The ability to create compelling visual charts with the tools at your disposal.
- Strategies and techniques for implementing these visual charts in your daily operations to drive growth and efficiency.
- Confidence in using data to make decisions that will satisfy customers and meet organizational goals.
Join us now and start transforming your business insights into tangible improvements with the power of visual charts! 🚀
By enrolling in "Visual Charts for Business Insights and Improvement," you're not just taking a course; you're embarking on a journey to master data visualization, enhance strategic thinking, and ultimately drive your business towards success. Don't miss this opportunity to make data work for you! 📈🎯
Course Gallery
Loading charts...