Learn Data Visualization and Become Data Analyst

Why take this course?
🚀 Course Title: Learn Data Visualization and Become a Data Analyst 🚀
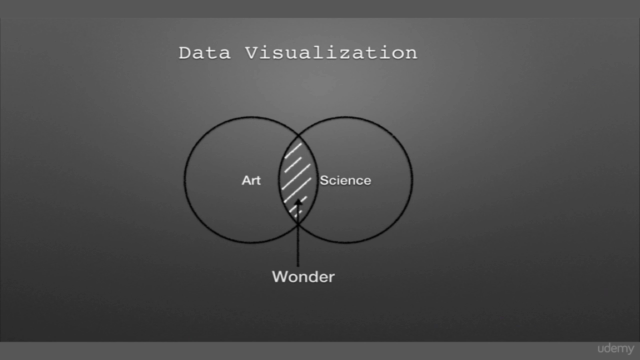
🎓 Headline: Master the Art and Science of Data Visualization in 7 Simple Steps with Real World Examples 🎓
Are you ready to dive into the world where art meets data? In today's data-driven era, the ability to interpret and visualize complex datasets is crucial for decision-makers across all industries. With our comprehensive online course, "Learn Data Visualization and Become a Data Analyst," you will unlock the secrets of effective data visualization—a skill that is not just about representing data graphically but also about telling compelling stories with it. 📊✨
Why This Course? Data is the new currency, and knowing how to harness its potential is a game-changer in any field. From healthcare to finance, from marketing to public policy, the power of data visualization can influence decisions, inspire strategies, and lead to innovative solutions. This course will guide you through a structured approach that demystifies the process and empowers you to create data visualizations that are both insightful and impactful.
Course Highlights:
-
A Simplified 7-Step Approach: We'll break down the complex process of data visualization into a manageable, seven-step approach, making it easy for you to grasp and apply.
-
Start on the Right Note: Learn how to initiate your visualization project in a way that sets you up for success.
-
Categorize and Characterize: Understand the different types of data visualizations and when to use them effectively.
-
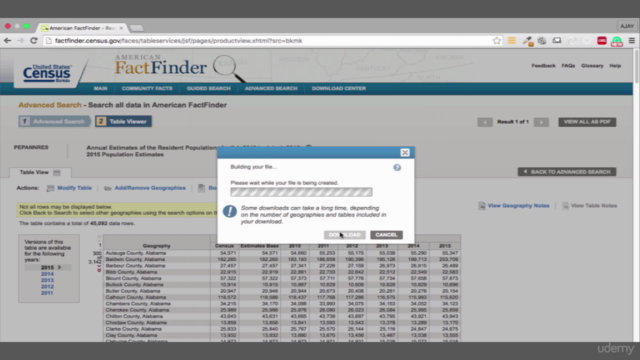
Real World Use Case: Get hands-on experience with an actual visualization challenge and see how it's solved in a professional setting.
-
UX-Centric Design: Discover how to approach design from a user experience (UX) perspective, ensuring your visualizations are not just beautiful but also intuitive and user-friendly.
-
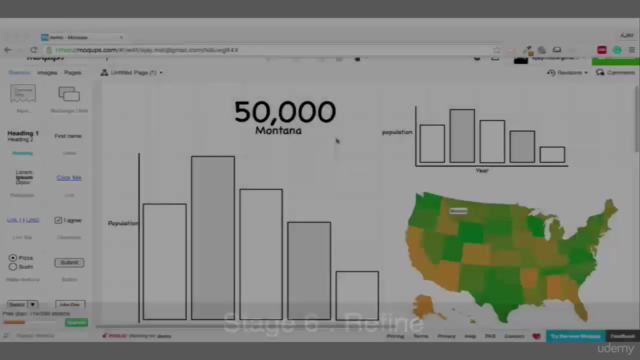
Wireframing Tools Mastery: Learn to use wireframing tools to sketch out your data visualization ideas before moving on to more complex implementation.
-
Bring Design to Life with D3: Finalize your design journey by learning how to use D3, one of the most powerful JavaScript libraries for bringing your designs to life and making them interactive.
By the end of this course, you will have a solid understanding of data visualization principles, a portfolio piece to showcase your new skills, and the confidence to tackle real-world data challenges head-on. 🌐🌍
Join the UI5 Community Network and embark on a journey to transform data into compelling stories with "Learn Data Visualization and Become a Data Analyst." Enroll now and step into the future of data analytics! 📈🚀
Course Gallery


Loading charts...