Tableau Desktop for Data Analysis & Data Visualization

Why take this course?
🚀 Tableau Desktop for Data Analysis & Visualization 📊✨
Course Title: Tableau Desktop for Data Analysis & Data Visualization
Headline: Learn data analysis with Tableau and prepare for a BI career or Tableau certification (10+ hours, Tableau Server not covered)
Unlock Your Data's Story with Tableau Desktop
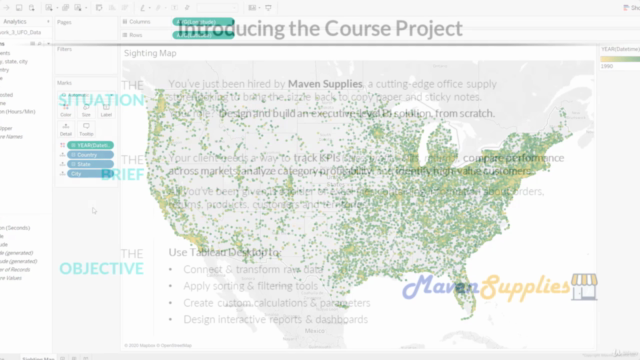
Welcome to the journey of transforming raw data into compelling stories! As you embark on this course, you'll be taking on the role of a Business Intelligence Analyst at Maven Supplies, where your mission is clear: harness the power of Tableau Desktop to create an executive-level dashboard from the ground up. 📈🎨
Course Overview:
This isn't just any course—it's a practical, hands-on and project-based introduction to Tableau designed for those ready to dive into the world of data analysis and visualization. Whether you're a beginner or an experienced analyst looking to sharpen your skills, this course will equip you with the knowledge and confidence to tackle any data challenge.
What You'll Learn:
- Data Exploration & Analysis: Get comfortable with Tableau's interface and capabilities for exploring and understanding large datasets. 📊
- Interactive Visualizations: Create interactive dashboards that allow users to dive deep into the data with just a few clicks. ➡️
- Advanced Data Visualization Techniques: Learn how to present data in ways that are both beautiful and insightful, using advanced chart types and design principles. 🎭
- Data Storytelling: Transform your findings into clear, actionable stories that decision-makers can't ignore. 📖
- Tableau Best Practices: Follow industry standards to ensure your visualizations are effective and your dashboards are user-friendly. ✅
Your Learning Path:
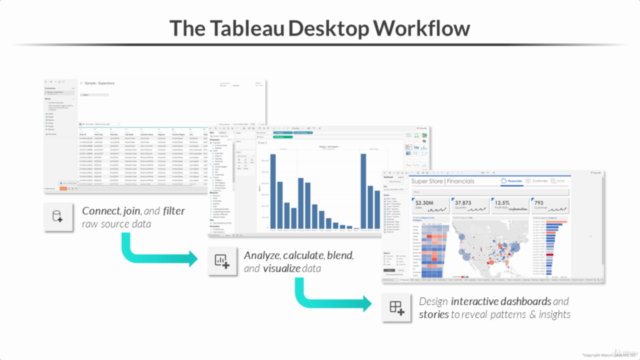
- Introduction to Tableau Desktop: Get acquainted with the platform, its interface, and how it handles data.
- Data Preparation: Learn how to clean, manipulate, and prepare data for analysis within Tableau.
- Interactive Dashboards: Build interactive dashboards that engage users and provide meaningful insights.
- Advanced Visualizations: Master advanced chart types and learn how to use them to highlight key insights from your data.
- Data Storytelling: Turn your analysis into a story that tells the narrative of the data, making it accessible and understandable to all audiences.
- Final Project: Apply everything you've learned by creating an end-to-end business intelligence dashboard from scratch.
Why Choose This Course?
- Expert Instruction: Led by Dustin, a featured Tableau author and lead instructor at Maven Analytics.
- Comprehensive Resources: Access over 10 hours of high-quality video content, a 100+ page eBook, downloadable project files, homework assignments, quizzes, and a dedicated Q&A forum.
- Immediate & Lifetime Access: Join the course today and benefit from lifetime access to all materials.
- Money-Back Guarantee: We stand by the quality of our courses with a 30-day money-back guarantee.
What Our Students Say:
🌟 "This is my fourth course from Maven Analytics and my fourth 5-star review...I wish Maven was in my life earlier!" — Tatsiana M.
🌟 "Excellent from start to finish. I picked up a bunch of techniques that will be useful in the workplace, from new chart templates to some very cool advanced visualizations. I loved all of it!" — Robert C.
🌟 "Maven Analytics should become the new standard for all courses taught on Udemy!" — Jonah M.
Ready to Become a Tableau ROCKSTAR?
Join the ranks of data professionals who have transformed their careers with Tableau. Enroll in this course today and take the first step towards becoming a master of data analysis and visualization. 🚀
Explore the Full Business Intelligence Stack:
Don't limit yourself to just Tableau—expand your skills with our full course library, which includes Excel, Power BI, MySQL, and more! Visit Maven Analytics to discover a world of analytics learning. 🌍
Final Note:
With the blend of theory and practical application, this course is designed to cater to a wide range of learners—from casual users to seasoned data science professionals. Embark on your data journey with Maven Analytics and become part of the analytics community that's shaping the future with data-driven decision-making! 🌐
Sign up now and turn your data into a story that matters! 🎉📊💡
Course Gallery


Loading charts...
Comidoc Review
Our Verdict
This course, led by a knowledgeable instructor, offers in-depth insight into Tableau, covering an extensive array of topics. Real-world examples contribute to a well-rounded experience; however, the fast pace may prove challenging for some learners. While minor concerns about delivery and version compatibility exist, this comprehensive program has the potential to empower learners with valuable data visualization skills.
What We Liked
- Covers a wide range of topics, making it ideal for those looking for comprehensive Tableau training
- Instructor is knowledgeable and thorough, providing in-depth explanations of various functionalities
- Real-world examples and case studies help illustrate concepts, enhancing understanding
- Well-structured course layout enables a smooth learning experience
Potential Drawbacks
- May be too fast-paced for some learners, causing them to feel overwhelmed by the sheer volume of information
- Lacks hands-on practice in the early stages, which could hinder the ability to grasp data manipulation skills
- Assorted feedback regarding instructor delivery, with some expressing a desire for a warmer, more engaging style
- Potential disconnect between course version and user's own Tableau version