Visualizing Sales Trends with Tableau

Why take this course?
📈 Unlock the Secrets of Sales Data with Tableau!
Course Headline:
"Visualizing Sales Trends with Tableau: Turn Data into Actionable Strategy for Business Success!"
Are you swimming in a sea of sales data but struggling to spot the ripples that matter? 🌊 In this comprehensive course, we'll dive into the world of data visualization using Tableau – a powerful tool that transforms complex datasets into clear, compelling stories. Whether you're a business owner seeking strategic insights or aspiring to master Tableau for your next career move, this course is tailored to guide you through a real-world consulting engagement scenario.
Course Description:
"Embark on a journey to understand and leverage your sales data like never before! We'll navigate through a hands-on consulting project that mirrors the challenges faced by businesses in planning for the future. By applying Tableau to our client's sample sales data, we'll uncover actionable recommendations that can shape marketing decisions and streamline supply chain operations. This course is designed to demystify Tableau, making it a problem-solving asset rather than just another software tool."
What You'll Learn:
- Use Tableau for Sales Data Analysis: 📊 Dive into your data and uncover the patterns that drive business decisions.
- Load Data into Tableau: Master the art of importing your sales figures efficiently.
- Utilize Data Dimensions to Uncover Key Insights: Discover how dimensions can reveal trends that affect sales performance.
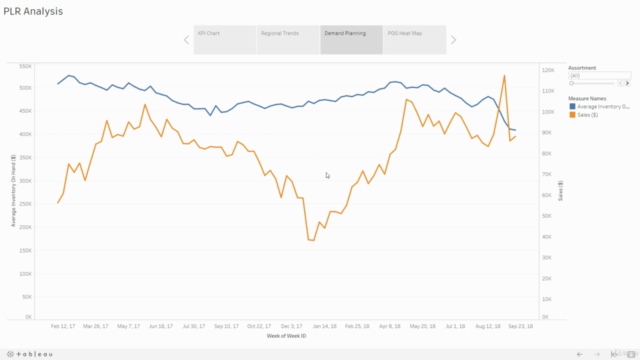
- Build Dual Axis Line Graph in Tableau: Learn to create dynamic visualizations that showcase your data's story.
- Geomap Sales by State: Visualize regional sales patterns and identify areas of growth or opportunity.
- Create a KPI Chart: Focus on the metrics that matter most with a chart designed for clarity and impact.
- Construct a Comprehensive Dashboard: Combine all your visualizations into an informative and user-friendly dashboard.
- Format Visualizations and Dashboards: Ensure your data story is presented professionally and effectively.
- Upload to Tableau Public: Share your findings with the world, demonstrating your Tableau expertise.
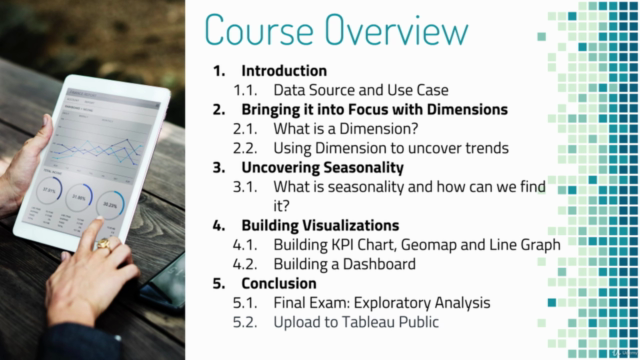
Course Contents and Overview:
As we work through this engaging project, you'll tackle real-world business challenges using Tableau as your analytical toolkit. From understanding the data source and use case to performing exploratory analysis and visualizing your findings, each step is designed to build upon the previous one, ensuring a comprehensive learning experience.
Course Breakdown:
-
Introduction 🎓
- Data Source and Use Case
-
Bringing it into Focus with Dimensions
- Understanding Dimensions
- Utilizing Dimensions to Uncover Sales Trends
-
Uncovering Seasonality
- Identifying Seasonal Patterns in Sales Data
-
Building Visualizations
- Crafting a KPI Chart, Geomap, and Line Graph
- Designing an Effective Dashboard
-
Conclusion 🏁
- Final Exam: Exploratory Analysis
- Upload to Tableau Public and Share Your Insights!
The final exam will challenge you to apply all the skills learned throughout the course to perform an exploratory analysis on behalf of our client. This is your opportunity to showcase how Tableau can uncover valuable sales trends that lead to informed business decisions.
Are you ready to transform your approach to sales data? 🚀 Enroll now and start your journey to becoming a Tableau data virtuoso!
Course Gallery


Loading charts...