The Ultimate Python Data Visualization Course- Step By Step
Why take this course?
📊 Master Data Visualization with Python: A Complete Step-by-Step Guide 📊 challenges you to become an expert in analyzing and presenting data through captivating visualizations. Dive into a world of insights using the powerful Python libraries – Matplotlib, Seaborn, Plotly, and more, ensuring you can turn complex datasets into compelling stories.
Course Includes:
-
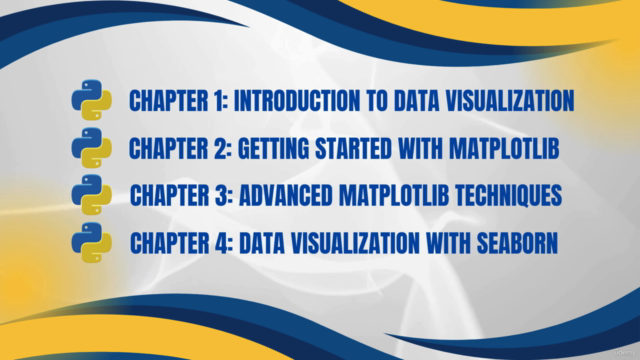
Introduction to Data Visualization with Python: Uncover the fundamentals of Python for data visualization and learn why it's essential to visualize data. Get started by installing the necessary libraries, setting the stage for your data visualization journey.
-
Getting Started with Matplotlib: Develop a solid foundation by creating basic plots like line plots, scatter plots, and bar charts, and master advanced techniques such as customizing ticks, adding annotations, and working with 3D plots. You'll also learn how to save your work in various formats.
-
Data Visualization with Seaborn: Dive into more sophisticated visualizations by exploring pair plots, heatmaps, and violin plots. Discover the power of Seaborn to customize aesthetics and visualize relationships within data.
-
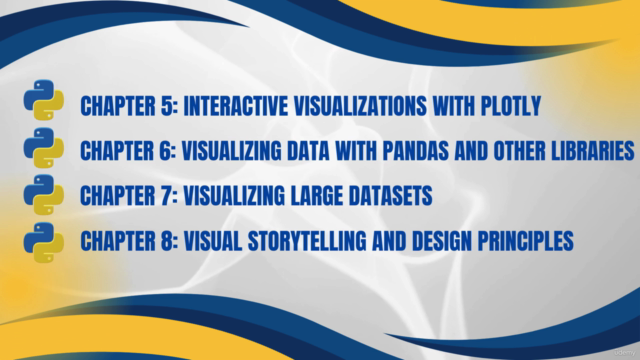
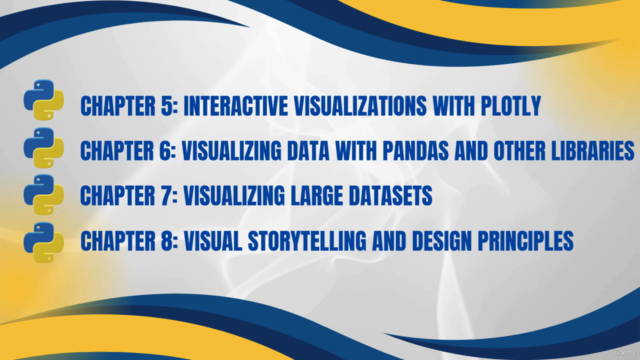
Interactive Visualizations with Plotly: Step into the world of interactive visualizations. You'll learn how to create engaging line, bar, and scatter plots, visualize geospatial data, and build your own interactive dashboards using Plotly Dash.
-
Visualizing Data with Pandas and Other Libraries: Elevate your visualization skills by integrating Pandas to quickly analyze and visualize data, explore time series data, and discover the capabilities of Altair and Bokeh for creating interactive charts.
-
Visualizing Large Datasets: Tackle big data challenges with strategies tailored for large datasets. Learn to use libraries like Dask and Vaex alongside Python to optimize performance and visualize massive amounts of data effectively.
-
Visual Storytelling and Design Principles: Master the art of data storytelling, understand the impact of color schemes in your visualizations, and apply design principles for enhanced readability and clarity.
This course is tailored for data analysts, business professionals, and anyone aspiring to make informed, data-driven decisions with confidence. With its comprehensive, step-by-step approach, "The Ultimate Python Data Visualization Course- Step By Step" will unlock your data's potential and transform you into a visualization expert.
Embark on this transformative journey today and start making your data speak volumes! 🚀🔤
Course Gallery
Loading charts...