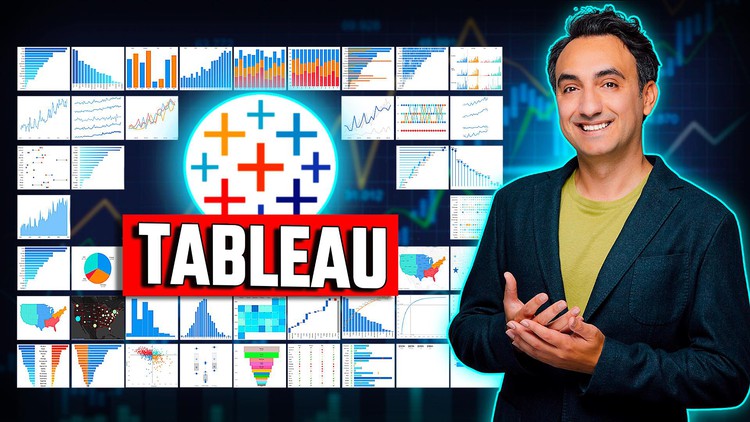
Tableau Ultimate Chart Masterclass: 63xCharts

Why take this course?
🌟 Master Tableau Charts Like a Pro! 🌟
Course Headline:
Tableau Ultimate Chart Masterclass (2024): 63xCharts & Data-Driven Success
Course Description:
Having Tableau skills is one of the employer's most requested skills of 2023! Learning Tableau is a fast-track to enhancing your career prospects. With over a decade of hands-on experience in data visualization, Baraa Khatib Salkini has distilled his expertise into this comprehensive Udemy course designed to elevate you from novice to master in the realm of Tableau.
Why This Course?
This is not just another Tableau course – it's a genuine, step-by-step guide that will take you through the intricacies of over 63 Tableau Charts, each carefully selected to help you visualize any dataset and meet various requirements. You'll learn when and how to use each chart type effectively.
What You'll Get:
- Materials provided for practice, including:
- A dedicated Dataset for Training to hone your skills.
- An extra Tableau file containing all 63 charts referenced throughout the course.
Topics Covered:
- The Power Of Data Visualization
- What is Tableau?
- Why Tableau is Leader in Visualization
- Download & Install Tableau
- Create Data Source
- Tour of the Tableau Interface
- Adding Multiple Measures in 1 View
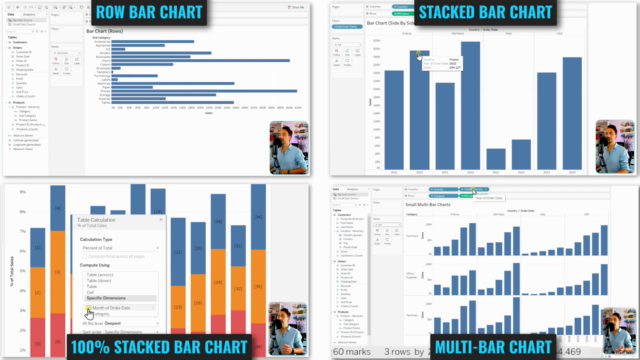
- Bar Charts
- Bar-in-Bar Chart
- Barcode Chart
- Line Charts
- Highlighted Line Charts
- Bump Chart
- Sparklines
- Barbell Chart
- Rounded Bar Chart
- Slope Chart
- Bar & Line Charts Combination
- Bullet Chart
- Lollipop Chart
- Area Charts
- Scatter Plots
- Dot Plot
- Circle Timeline
- Pie & Donut Charts
- Treemap & heatmap
- Bubble Charts
- Maps
- Histograms
- Calender Charts
- Waterfall Chart
- Pareto Charts
- Butterfly (Tornado) Chart
- Quadrant Chart
- Box Plot
- Bar Chart with KPI
- BANs (Business Analytics Narratives)
- Funnel Chart
- Progressbar
- How to Choose the Right Chart!
- Tableau Quiz
- Tableau Project
Don't let your data go untapped! Master Tableau and stand out in the job market with skills that are highly sought after by employers across industries. With this course, you'll not only understand how to use each chart type but also when it's most effective to apply them for impactful analysis.
Enroll today and join the ranks of data visualization experts who use Tableau to transform raw data into compelling narratives that influence decisions, drive innovation, and lead to success. 📊✨
Course Gallery


Loading charts...