The secrets to generate the most automated Excel Dashboards
Why take this course?
🚀 Master the Art of Automated Dashboards in Excel! 🚀
Welcome to "The Secrets to Generate the Most Automated Excel Dashboards" – a comprehensive course designed to transform you into an Excel dashboard wizard 🧙♂️✨. This isn't just about understanding Excel; it's about elevating your data analysis skills to the next level with automation!
Course Overview:
In this hands-on course, you'll dive deep into the functionalities, shortcuts, formulas, and interfaces that make up the backbone of automated Excel dashboards. By the end of this journey, you'll be able to create dynamic, interactive, and fully automated dashboards that can think for themselves! 🤖💡
What You'll Learn:
- Connecting Form Commands & ActiveX Controls: Learn how to link these powerful tools to your data cells and ranges for a seamless automation experience.
- Automated Charts: Discover how a single cell modification can lead to an entire chart update, saving you time and effort.
- Dynamic Images: Create images that reflect the latest data updates in real-time, providing an eye-catching visual representation of your information.
- Excel Functions & Formulas: Master the art of creating tables, data sources, summary reports, and more with Excel's robust functions and formulas.
- Lookup & Reference Formulas: Combine these formulas to retrieve and join values between different datasets, making your dashboards even more powerful.
- Variable Charts with Dynamic Data Series: Learn how to generate charts with data series that update automatically as your data changes.
Real-World Examples:
The course is packed with practical examples that cover a variety of business areas:
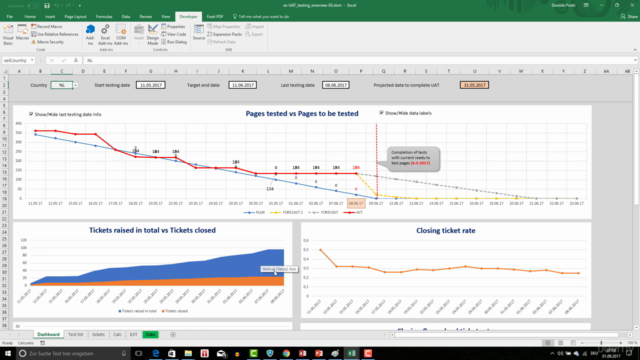
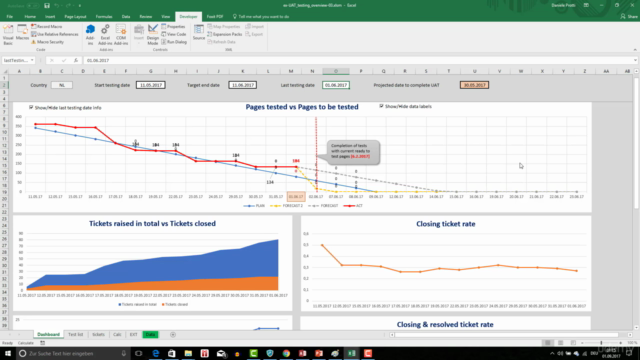
- Dashboard Testing Activities: Understand the critical aspects of testing dashboards for accuracy and performance.
- Interactive Dashboard in Excel Using Hyperlinks: Create dashboards that come alive with interactive hyperlinks.
- Interactive Sales Chart: Learn how to make a sales chart that updates as soon as data changes, providing instant insights.
- KPI Dashboards: Craft dynamic KPI dashboards that track the most important metrics in your business.
- Pivot Tables & Slicers: Make your dashboards interactive and easy to navigate using Pivot Tables and Slicers.
- Customer Service Dashboard: Visualize customer service performance data to identify areas of improvement.
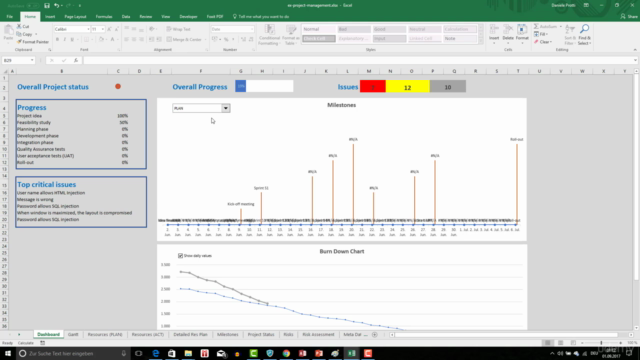
- Project Management Dashboard / Project Status Report: Track project progress, timelines, and deadlines with a comprehensive dashboard.
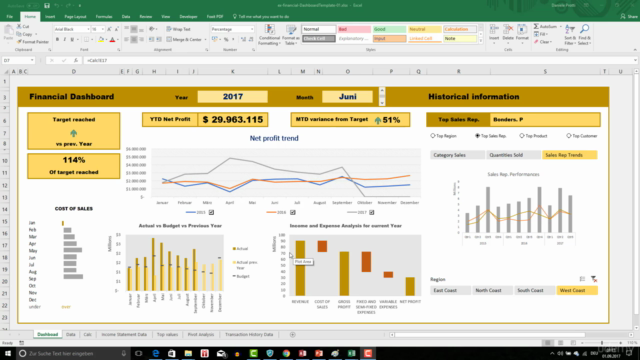
- Financial Dashboard: Analyze financial data with a dashboard that offers insights into your budgets, revenues, and expenses.
Bonus Skills:
As a cherry on top, we'll also touch upon implementing Visual Basic for Applications (VBA) to enhance the functionalities of Excel. VBA will allow you to create macros and functions that can automate repetitive tasks and make your dashboards smarter and more responsive. 🎫
Join Us on This Data-Driven Adventure!
Whether you're an aspiring data analyst, a business professional looking to harness the power of data, or simply someone fascinated by the capabilities of Excel, this course is for you. Embrace the future of data analysis with automated dashboards that work around the clock to provide the insights you need at your fingertips. 📊💫
Enroll now and start your journey towards becoming an Excel dashboard expert! Your data awaits, and it's full of stories waiting to be told. Let's uncover them together! 🌟🎉
Course Gallery
Loading charts...