The Complete Introduction to Data Analytics with Tableau

Why take this course?
🌟 Kickstart your Data Analytics Career with Tableau! 🌟
Are you on the brink of diving into the world of Data Analytics but feeling a bit lost in the sea of data? Fear not! This is the course that will transform your curiosity into competence, and your enthusiasm into expertise. With "The Complete Introduction to Data Analytics with Tableau," you're not just learning—you're embarking on a journey to master one of the most sought-after skills in today's data-driven marketplace.
Why Choose This Course?
- 🔍 Hands-On Learning: Engage with real-world projects that mirror the challenges you'll face in a professional setting.
- 🚀 Career Boost: Equip yourself with practical skills that will set your resume apart, making you an attractive candidate for employers.
- 💼 Real-World Applications: Work on case studies from various industries, including retail, travel, finance, and more!
- 📊 Expert Instruction: Learn from a seasoned professional who brings years of expertise in data analytics and visualization with Tableau.
What You Will Master:
In this course, you will learn:
- Create 6 interactive dashboards and publish them online for real-world impact.
- Connect to various data sources: Excel, Google Sheets, and Cloud Servers.
- Develop a variety of charts such as bar charts, line charts, donut charts, maps, tables, and dual axis charts.
- Craft calculated fields, including IF statements and other complex calculations.
- Utilize sets, hierarchies, and groups to refine your data analysis.
- Understand joins, Level Of Detail (LOD) calculations, and create Parameters for dynamic user interaction.
- Make use of the analytics pane with trend lines for time series analysis.
- Design interactive dashboards using dashboard actions.
- Set up a dashboard that updates daily via Google Sheets.
Your Journey Through Real Projects:
Projects you will work on:
- Discount Mart: Analyze sales data to provide insights on performance for this year, including Sales, Profit, and Quantity Sold.
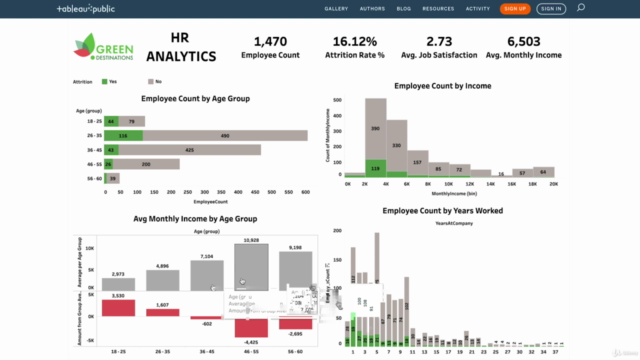
- Green Destinations: Investigate employee attrition trends within a travel agency to help improve retention rates.
- MyPaper: Monitor Accounts Receivable and identify customers with overdue payments in the paper supply industry.
- Super Store: Track sales agents' performance across various states in the USA for a major retailer.
- Northwind Trade: Gain visibility into FMCG orders, shipment statuses, and delivery destinations for a global trading company.
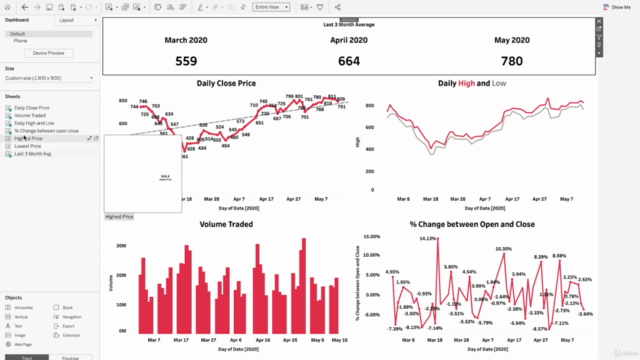
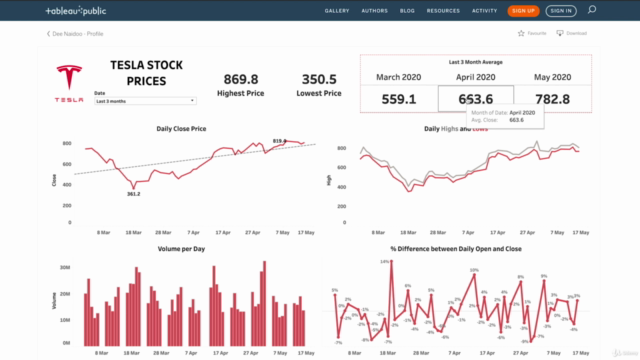
- Tesla: Analyze stock price trends over the past three months for an American electric vehicle and clean energy company.
By completing this course, you'll not only be a highly proficient Tableau user but also have a solid foundation in understanding the data pipeline from start to finish. You'll be able to take any dataset and turn it into compelling stories through data visualization, ready to impress potential employers or clients with your newfound expertise!
Enroll now and embark on a career-changing journey with Tableau! 📊✨
Course Gallery


Loading charts...
Comidoc Review
Our Verdict
The Complete Introduction to Data Analytics with Tableau is a well-rounded course offering valuable insights into data analytics. Despite minor issues like outdated content, and inconsistent project resources, hands-on projects promote practical understanding of the concepts learned. Enhancing the theoretical aspects by incorporating real-life scenarios, guided practice, and improved structure will further polish learners' expertise.
What We Liked
- This course offers a comprehensive introduction to data analytics with Tableau, providing a solid understanding of the data analytics pipeline, data visualization techniques, and various types of joins.
- The hands-on approach, with 5 interactive dashboard projects, enables learners to confidently apply concepts in real-world scenarios and improve their skills.
- Instructors are knowledgeable and helpful, providing explanations that cater to both beginners and experienced coders, encouraging deeper understanding.
Potential Drawbacks
- The course content is somewhat dated, resulting in discrepancies between the screens shown in the course and the current product interface.
- Projects require resources like database drivers and external accounts (e.g., Google), which may not be thoroughly addressed in the class.
- A more structured approach in teaching would help beginners get familiar with concepts faster, instead of presenting them in a haphazard manner.
- Calculation examples and practical exercises are sometimes basic; learners might benefit from more advanced and real-life scenario examples.