Tecplot 360

Why take this course?
🚀 Master CFD Visualization with Tecplot 360: A Comprehensive Online Course 🎓
Headline: Unlock the Full Potential of Your CFD Data with Advanced Visualization Techniques!
Are you ready to elevate your Computational Fluid Dynamics (CFD) results from good to extraordinary? Whether you're a seasoned engineer or a curious student, this course will equip you with the skills to visualize your CFD data in ways that will make your findings stand out. 🌟
Why This Course?
- For Researchers & Engineers: Learn to prepare your CFD results with the precision and quality required for high-impact journal submissions.
- For Learners & Enthusiasts: Gain a deep understanding of Tecplot 360's post-processing capabilities, from basic to advanced levels.
- For Professionals & Hobbyists: Become the go-to expert in your group for meticulous CFD data visualization.
Course Overview: This course is a journey through the powerful features of Tecplot 360, designed to help you:
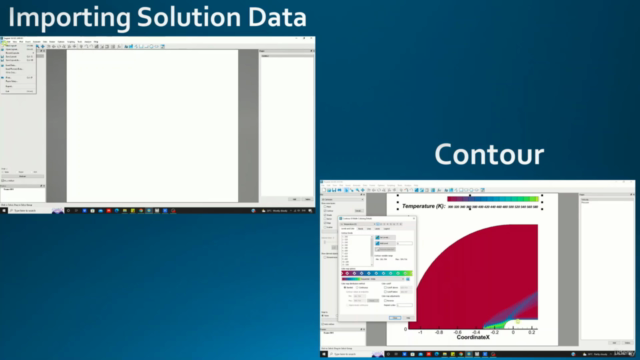
🔹 Import Data Seamlessly: Master importing both 2D and 3D solution data into Tecplot 360.
- Optimize Display: Learn how to set up window layouts, enhance legends for clarity, and format levels and contours with precision.
- Refine Axis and Data Probing: Gain proficiency in modifying axis properties, probing data points, and adding shapes, text, or arrows for emphasis.
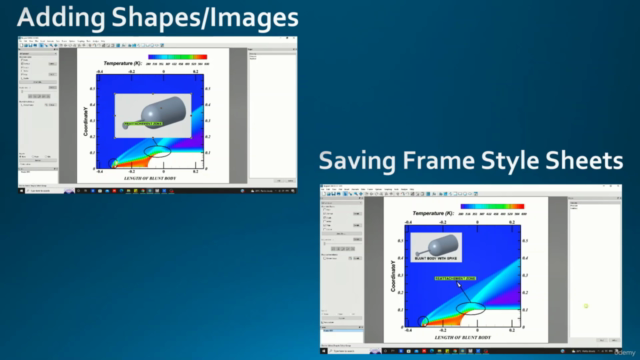
- Enhance Visual Representation: Discover how to add images, save frames, and use style sheets to maintain consistency throughout your visualizations.
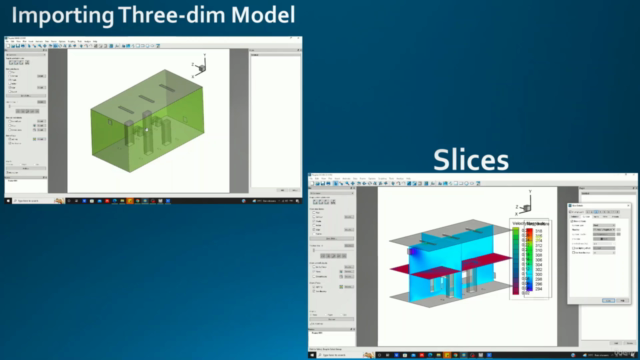
- Work with Contours and Vectors: Understand the nuances of contour types, create labels and slices, represent vectors on slices, and much more.
- Create Dynamic Animations: Learn to generate animations that bring your data to life and help explain complex phenomena.
- Utilize Advanced Features: Explore the use of 3D stylesheets, iso surfaces, streamtraces, and macros for automating tasks.
- Perform Data Analysis: Utilize interaction tools, extract slices, perform integrations, and run macros to analyze your data in depth.
What You Will Learn: 🚀 Importing & Preparing Data:
- Import 2D and 3D solution data with ease.
- Set up efficient window layouts.
- Perfect your legend for an immediate understanding of the data represented.
📊 Data Visualization Techniques:
- Utilize levels and number formats to present data accurately.
- Modify axes to highlight important areas or data points.
- Probe into data for a closer look with advanced tools.
- Add custom shapes, text, arrows, and images to emphasize critical results.
🎨 Advanced Visualization:
- Create high-quality labels and slices to isolate specific parts of the data.
- Represent vectors and contours on slices for a more in-depth analysis.
- Animate your data to illustrate changes over time or space.
- Use 3D stylesheets and create iso surfaces for a true-to-life perspective.
🔍 Data Analysis Tools:
- Explore the power of field variables, axes, and equations in 2D Cartesian plots.
- Understand how to perform integrations on your data for quantitative analysis.
- Learn to record and run macros for repetitive tasks.
Who Should Take This Course? This course is ideal for:
- Engineers: Who want to enhance their CFD reports with high-quality visualizations.
- Research Scientists: Looking to publish CFD findings in scientific journals.
- Students: Aspiring to understand the post-processing of CFD data.
- Professionals: In need of a competitive edge in data analysis and representation.
Join Now and Transform Your Data into Compelling Visual Stories! 📈✨ Don't miss out on this opportunity to become an expert in visualizing CFD data with Tecplot 360. Enroll today and take the first step towards creating impactful, clear, and captivating visualizations that will set your work apart. Let's make your CFD results not just readable, but unforgettable! 🚀📚✨
Course Gallery


Loading charts...