Technical Analysis tools for Stocks and Options trading

Why take this course?
📈 Master Technical Analysis for Stock and Options Trading 📈
Course Title: Technical Analysis Tools for Stocks and Options Trading
Headline: An In-depth Look at Various Technical Analysis Tools to Give Traders an Edge
Course Description:
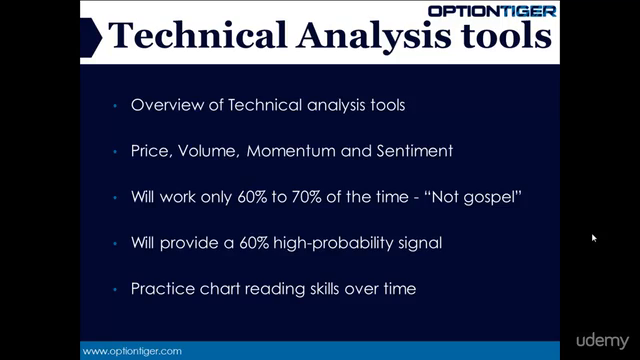
Technical analysis has carved out a significant niche in the trading world, particularly as it is effective 60-70% of the time. When fundamental events dominate the markets, technical patterns step into the spotlight. In those 60-70% of periods without major fundamental events, these patterns are all traders have to guide their decisions, making them invaluable tools.
In this course, we'll dive deep into the various categories of technical analysis:
- Price Indicators
- Support and Resistance Levels
- Momentum Indicators
- Volume Indicators
- Oscillators
- Statistical Price Movement Indicators
Embracing the Keep It Simple Siliaropan (KISS) philosophy, we'll guide you through the noise and focus on the key indicators that matter. These tools are essential for making informed entry and exit decisions and understanding the psychology behind market movements.
Why Technical Analysis? 🎯
Technical analysis is more than just a set of rules or patterns; it's a self-fulfilling prophecy that reveals the collective behavior of traders and investors. The more everyone follows these patterns, the more likely they are to act in concert – which can be a powerful phenomenon to understand and anticipate.
Practical Application & Live Trading Demonstrations 🧐
The beauty of technical analysis lies not just in theory but in practical application. That's why this course includes real-time trading platform demonstrations, showcasing how these tools are applied in live market scenarios. You'll see several examples of each tool in action, providing you with a deeper understanding and a solid foundation to apply them to your own trading strategies.
What You Will Learn 📚
This comprehensive suite of Technical Analysis tools will cover the following:
- Support and Resistance: Identifying levels where price trends may reverse.
- The MACD Indicator: A trend-following momentum indicator that shows the relationship between two moving averages of a security’s price.
- Oscillators: Tools like RSI (Relative Strength Index) that measure the speed and change of price movements.
- Understanding Standard Deviation & Bollinger Bands: Gauging market volatility and identifying overbought or oversold conditions.
- On Balance Volume (OBV): Understanding volume flows in and out of a security.
- Fibonacci Retracements: Identifying potential reversal levels based on the Fibonacci sequence.
- Market Strength Indicators: Determining the overall strength of a market or asset.
- Understanding Volume Profiles: Analyzing price action around different volume sizes to find areas of strong supply and demand.
- Probability Analysis: Applying statistical tools to predict the probability of future price movements.
Your Journey to Trading Mastery Awaits 🚀
By the end of this course, you'll have a clear understanding of how to apply these powerful technical analysis tools to enhance your stock and options trading strategies. Whether you're a beginner or looking to refine your expertise, this comprehensive guide will equip you with practical knowledge and skills to navigate the markets confidently.
Enroll now and embark on your journey to becoming a savvy, informed, and successful trader! 🚀💡📈
Course Gallery


Loading charts...