Correlation & Regression in Minitab – Tabtrainer® Essentials
Master Pearson correlation, linear regression, matrix plots & prediction intervals in Minitab – for real industrial data
1
students
1 hour
content
May 2025
last update
$19.99
regular price
What you will learn
Understand the difference between correlation and regression and when to use each method.
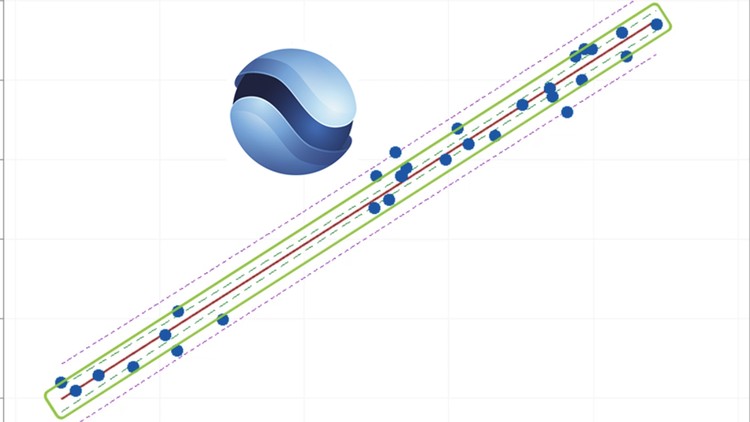
Perform a Pearson correlation analysis to identify linear relationships between two continuous variables.
Interpret the correlation coefficient (r) and p-value to assess the strength and significance of relationships.
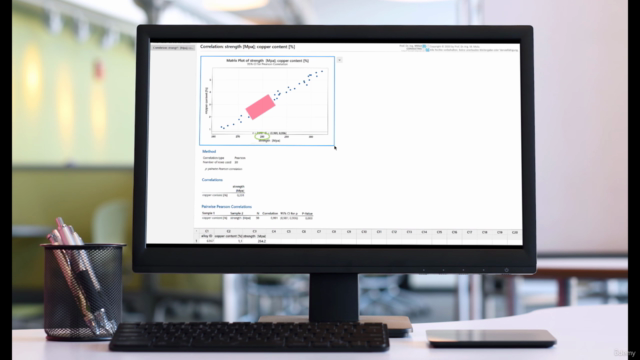
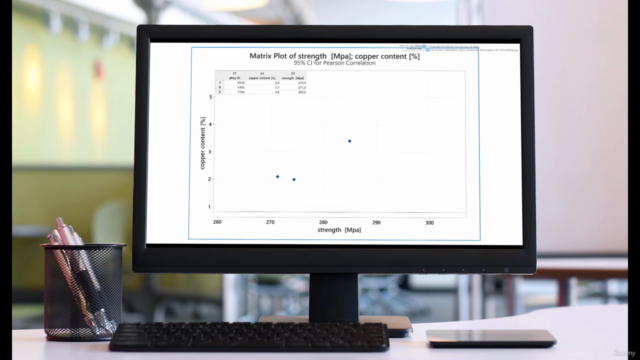
Create and interpret scatterplots and correlation matrices using real process data.
Understand the limitations of correlation analysis when it comes to prediction and causality.
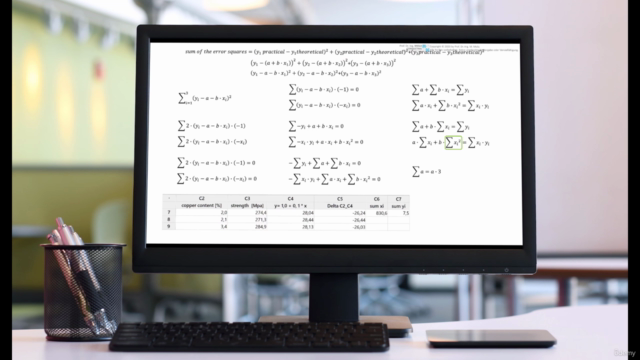
Learn how to derive and apply a regression function using the method of least squares.
Use Minitab to perform regression analysis and extract the regression equation automatically.
Evaluate the quality of a regression model using R-squared, adjusted R-squared, and residual plots.
Understand and differentiate between confidence intervals and prediction intervals in regression.
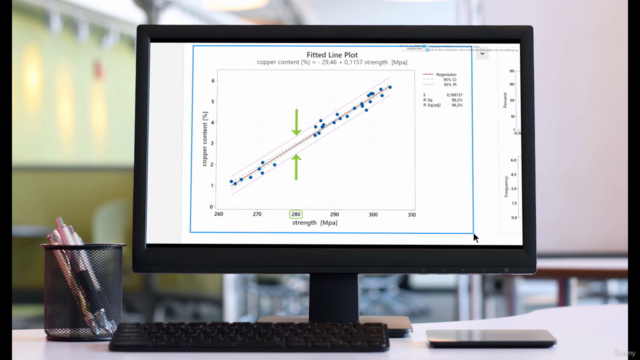
Make data-based predictions (e.g. copper content for 280 MPa strength) and use them to support business decisions.
Understand the purpose and application of multiple correlation analysis in a real-world industrial context.
Use a matrix plot to visually identify strong pairwise correlations among multiple quantitative variables.
Interpret the Pearson correlation coefficient to assess the degree of linear relationship between variables.
Perform and interpret the pairwise Pearson correlation test, including significance evaluation via p-values.
Derive data-driven recommendations based on statistical evidence—such as identifying redundancies among test pilots.
Recognize the importance of statistical significance in distinguishing between assumed and actual correlations in a population.
Save and document correlation analysis results as part of a structured data analysis project.
Course Gallery
Loading charts...
6563841
udemy ID
09/04/2025
course created date
02/05/2025
course indexed date
adedayo0001
course submited by