One-Way ANOVA in Minitab – Tabtrainer® Quality Analysis
Compare supplier performance with One-Way ANOVA in Minitab – interpret p-values, F-tests, and post-hoc results.

1
students
33 mins
content
May 2025
last update
$19.99
regular price
What you will learn
Understand the practical relevance of One-Way ANOVA in comparing multiple process mean values.
Recognize when ANOVA is the appropriate statistical method (i.e., more than two groups to compare).
Learn how to set up a supplier benchmark study with real manufacturing data.
Interpret descriptive statistics (mean and standard deviation) to gain an initial understanding of sample distributions.
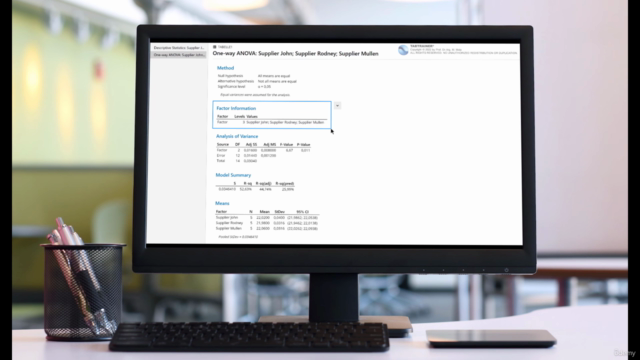
Understand the null hypothesis (equal means) and alternative hypothesis (at least one mean differs).
Learn how to calculate and interpret the p-value in the context of ANOVA.
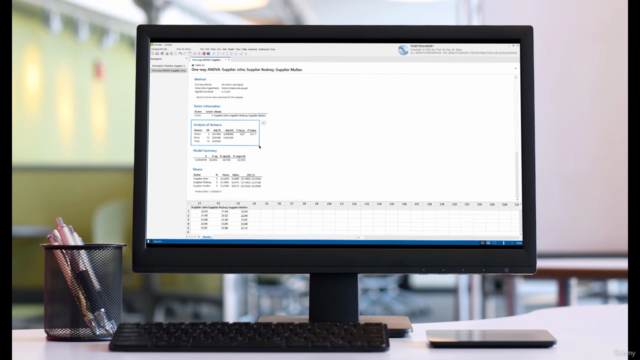
Understand the concepts of total variance, between-group variance (factor), and within-group variance (error).
Learn the definitions and roles of: Degrees of freedom (DF), Adjusted Sum of Squares (SS), Adjusted Mean Squares (MS), F-value and its relation
Understand the step-by-step calculation of variance components and the F-ratio using small sample sizes.
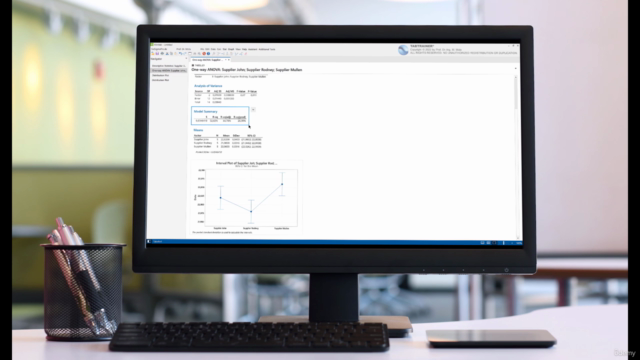
Use F-distribution plots to interpret p-values and rejection regions visually.
Apply Fisher’s Pairwise Comparison Test to identify which groups differ significantly.
Understand the concept of grouping letters and their meaning in post-hoc analysis.
Learn to communicate statistically significant findings clearly and translate them into actionable recommendations for quality improvement.
Learn how ANOVA results support decision-making in supplier selection and standardization.
Recognize the benefit of standardizing manufacturing processes across suppliers to reduce variation.
Course Gallery

Loading charts...
6551251
udemy ID
02/04/2025
course created date
02/05/2025
course indexed date
adedayo0001
course submited by