Tableau for Everyone: A Complete Guide to Data Visualization

Why take this course?
🌟 Master Data Science with Tableau: The Complete Tableau Bootcamp for Aspiring Data Scientists 🌟
Course Overview:
Dive into the world of data visualization and storytelling with our comprehensive Tableau Bootcamp, tailored for absolute beginners. With hands-on learning and advanced topics covered, you'll be ready to create impactful visualizations from scratch by the end of this course. Whether it's your first encounter with data or you're looking to refine your skills, this bootcamp will guide you through every step of the way.
What You Will Learn:
🚀 Initial Setup:
- Installing Tableau Desktop Public/Professional Edition and understanding its different products.
- Creating a Tableau Public profile and learning how to publish and download visualizations.
📊 Tableau Core Concepts:
- Connecting to data sources, understanding data types, dimensions & measures, aggregation, and granularity.
- Working with discrete and continuous fields, date parts, and calculated fields.
🧠 Tableau Fundamentals:
- Sorting data, applying dimension/measure filters, and using date and context filters.
- Organizing data with hierarchies, creating sets, and using parameters and custom shapes.
- Mastering animations, adding visualizations in tooltips, and working with custom dates.
📈 Chart Types:
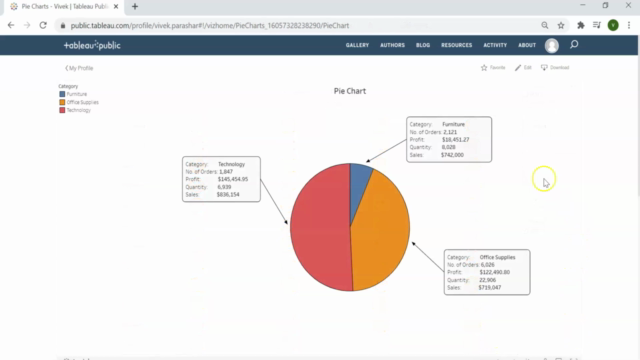
- Exploring various chart types like Bar, Line, Stacked Bar, Symbol Maps, Scatter Plot, and many more.
📚 Dashboard and Stories:
- Building interactive dashboards with actions, understanding dashboard objects, and navigating between dashboards.
- Embedding YouTube videos and integrating Google Analytics data within your visualizations.
- Crafting compelling stories to tell your data's narrative effectively.
🔄 Data Preparation:
- Utilizing Tableau's new Data Model, establishing relationships, joins, cross-database joins, blends, and unions.
- Knowing when and how to apply Relationships, Blends, Joins for optimal data processing.
Course Structure:
-
Version 2020.3: Learn with the latest version of Tableau, ensuring you're up-to-date with the newest features and functionalities.
-
Advanced Topics: Cover essential topics such as Relationships, Joins, and Blends to prepare your data for robust analysis.
-
Interactive Learning: Engage with hands-on exercises that allow you to apply what you've learned in real-time.
-
Advanced Charting: Discover how to present data effectively using a variety of chart types, including the Lollipop Chart and Heat Maps.
-
Dashboard Mastery: Learn to create dynamic dashboards with actions, and craft compelling stories that make your data insights come alive.
-
Final Project: Cap off your learning with a final project that will showcase your new skills in creating professional-grade visualizations and interactive dashboards.
Why Choose This Bootcamp?
✅ Access to expert instructors who are masters of Tableau and data visualization. ✅ A structured curriculum that takes you from beginner to proficient. ✅ Real-world case studies and examples that resonate with current market demands. ✅ A supportive community of fellow learners and professionals. ✅ Lifetime access to course materials, keeping the learning going beyond the bootcamp.
Embark on your journey to becoming a data visualization expert today! 🚀📊👨💻✨
Course Gallery


Loading charts...