Tableau Fundamentals: Get Started with Data Visualization

Why take this course?
Course Instructor: Arthur Fong
Course Title: Tableau Fundamentals: Get Started with Data Visualization
Headline: From Data to Insight: Creating Impactful Visualizations
Course Description:
🔍 Dive into the World of Data Visualization: Get ready to embark on an enlightening journey into the realm of data visualization with "Tableau Fundamentals: Get Started with Data Visualization." This course is your gateway to mastering Tableau, the premier tool that transforms raw data into compelling stories. It's tailored for beginners who are eager to harness the power of data to derive actionable insights and make data-driven decisions.
👉 Essential Skills, Practical Experience:
- Understanding Tableau's Interface: Familiarize yourself with the basics of navigating and operating within the Tableau environment.
- Connecting to Data Sources: Learn how to link Tableau with various data sources, including CSV files, databases, and online data sets.
- Data Transformation Techniques: Gain proficiency in filtering, sorting, and grouping data to refine your datasets for analysis.
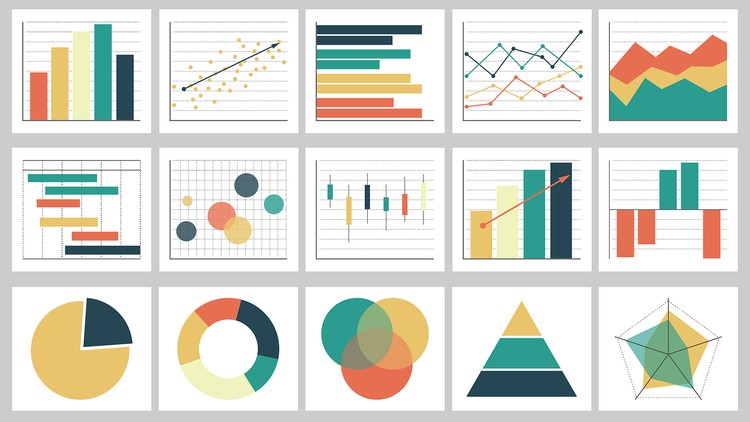
- Creating Basic Visualizations: Start with the fundamentals - bar charts, line graphs, and pie charts - and build a strong foundation in data visualization.
🌟 Advancing to Complex Data Artistry:
- Complex Visualizations: Explore the creation of advanced visualizations like heat maps, tree maps, and scatter plots.
- Calculated Fields & Aggregates: Discover how to perform sophisticated data manipulations using calculated fields and aggregates to uncover deeper insights.
- Interactive Dashboards: Combine multiple views to create dynamic dashboards that are both interactive and user-friendly.
🛠️ Tools for Interactive Analysis:
- Parameters & Filters: Learn how to use parameters and filters effectively to enhance the interactivity of your visualizations, allowing users to drill down into data with ease.
🚀 Publishing & Sharing Insights:
- Sharing Your Dashboards: Master the final step in the data visualization process by learning how to publish your interactive dashboards and ensure they reach a wide audience.
📈 Real-World Application: By the end of this course, you'll have all the necessary tools and best practices at your fingertips to create effective, impactful data visualizations that can drive informed decision-making in any organization. Whether you're aiming to launch a career in data analytics or looking to sharpen your existing skill set, "Tableau Fundamentals: Get Started with Data Visualization" offers the foundational knowledge and skills you need to succeed.
Join us on this exciting journey into the world of Tableau, where you'll transform data into a powerful story that speaks volumes. 📊✨
Enroll now and start your journey towards becoming a data visualization expert with "Tableau Fundamentals: Get Started with Data Visualization." Let's turn raw data into captivating insights together! 🌟💡
Course Gallery


Loading charts...