Tableau 2020 Training for Data Science & Business Analytics

Why take this course?
📚 Tableau 2020 Training for Data Science & Business Analytics
Course Overview
Embark on a journey to master data visualization with Tableau 2020
Whether you're a beginner or an intermediate user, this course will guide you through the intricacies of Tableau, enhancing your ability to present information and tell compelling stories using data. With hands-on practice exercises and real-world applications, you'll learn to create stunning visualizations that make complex data understandable for anyone.
What You'll Learn
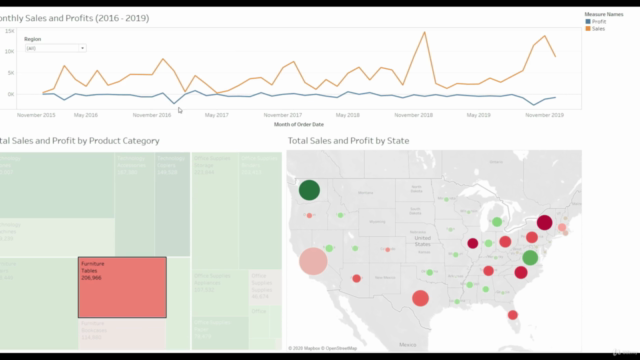
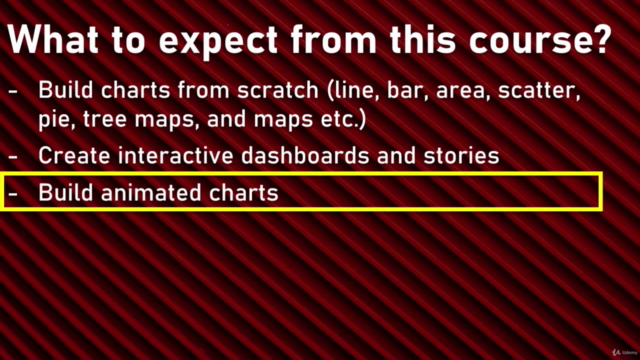
- Creating interactive charts and dashboards
- Building calculations and performing data clean-up
- Combining data from multiple sources
- Developing stories with your data visualization
- Exporting and distributing your workbooks effectively
Course Highlights
- Interactive Learning: Engage with intuitive drag-and-drop interfaces to learn Tableau's powerful features.
- Practical Experience: Apply what you learn through hands-on exercises tailored to enhance your data visualization skills.
- Comprehensive Coverage: From the basics of creating charts to advanced techniques like data modeling and storytelling, this course covers it all.
- Real-World Scenarios: Learn how Tableau is used in various industries to solve real business problems.
- Expert Guidance: Led by Farzan Sajahan, a seasoned consultant with over 15 years of experience in analytics and data science.
Who Should Enroll?
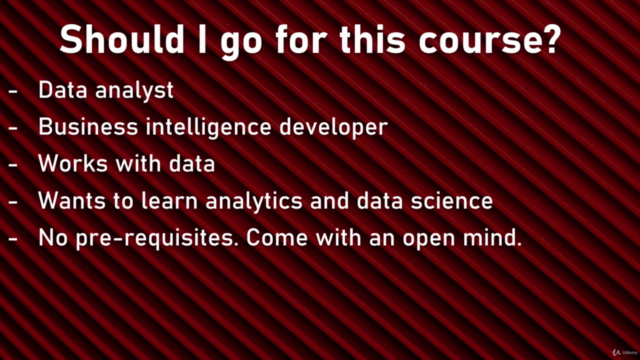
- Data Scientists and Analysts aiming to enhance their visualization skills.
- Business Intelligence Developers looking for tools to streamline their processes.
- Marketers seeking to understand data patterns and make data-driven decisions.
- Professionals in Operations Management who want to leverage analytics for problem-solving.
- Anyone passionate about turning data into compelling narratives.
Why Tableau?
Tableau is a market leading tool that simplifies the way you interact with data, enabling you to create stunning visualizations without extensive programming knowledge. It's an invaluable asset for anyone working with data, offering a competitive edge in career advancement within data science, analytics, and business intelligence.
About Your Instructor
My name is Farzan Sajahan, and I bring over 15 years of experience in helping organizations make informed decisions through data-driven strategies. As an electronics and communication engineering graduate from Anna University and an MBA alumnus from Erasmus University, I've dedicated my career to analytics and teaching. Based in Chennai, India, I lead an analytics consulting firm and teach at prestigious business schools, equipping students with the skills they need to excel in today's data-centric world.
Join us on this transformative learning experience with Tableau 2020 Training for Data Science & Business Analytics. Elevate your career by becoming a master of data visualization and storytelling. Enroll now and take the first step towards becoming a data hero! 🚀
🔗 Sign Up Now to start your journey with Tableau 2020 and unlock the power of data!
Course Gallery


Loading charts...