Tableau | A Quick Start Guide Part 2

Why take this course?
Welcome to "Tableau | A Quick Start Guide Part 2"! 🚀
Hey there, Data Explorer! Whether you're a newbie ready to dive into the world of data visualization or someone looking to complement your skills with Tableau, you've come to the right place. 📊
Course Overview: This is the continuation of our journey through the dynamic realm of Tableau, picking up where "Tableau | A Quick Start Guide Part 1" left off. Due to certain limitations set by the site, these courses have been split into two parts. However, fear not! You can absolutely take this as a standalone course or pair it with Part 1 for the complete experience. 🤝
Why Enroll? Imagine having a mountain of data – spreadsheets, databases, you name it – all looking like an impenetrable jungle. Tableau is your machete through that thicket, transforming raw data into captivating visual stories. With its intuitive interface and powerful capabilities, creating interactive and insightful dashboards can be not just useful but downright enjoyable. 🌿✨
What You'll Learn:
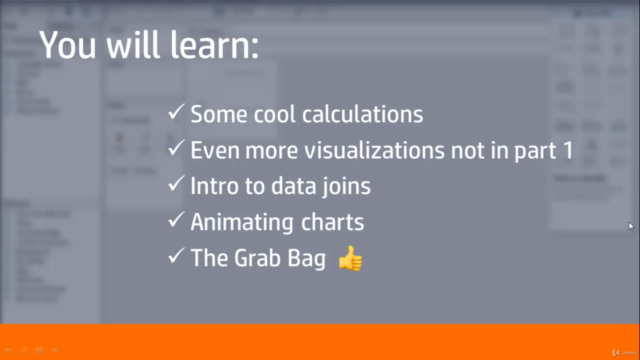
- Foundational Topics: We'll cover the basics to give you a strong foundation in Tableau. This includes an introduction to essential functions like DateDiff, calculated fields, IF and CASE statements.
- Visualization Types: Get hands-on with creating various types of visualizations such as bullet graphs, scatter plots, histograms, control charts, and more.
- Joining Types & Animation: Learn about the different types of joins in Tableau and how to animate your visualizations for a dynamic presentation.
- Miscellaneous Topics: We'll wrap up with a look at some grab-bag topics that will further expand your knowledge.
Course Structure: The modules are designed to be topical, allowing you to learn in the order that suits you best. While there's an attempt to create a logical flow, you can jump around as you please. 🚧➡️✨
What's Covered in Part 2:
- Calculations in Tableau: Master DateDiff, calculated fields, and conditional logic with IF and CASE statements.
- Advanced Visualizations: Craft various types of graphs to tell your data's story effectively.
- Data Joining & Animation: Understand the different join types in Tableau and how to bring your visualizations to life with animations.
- Final Walkthrough: A review of some additional topics that will round out your knowledge of Tableau.
Important Notes:
- The course content is applicable to Tableau 9.x and higher, even though the videos were produced using Tableau 9.
- As this course is free, it's a gift meant to empower you with skills that could make a significant difference in your professional journey. 🎁
Instructor's Perspective: ** IMPORTANT** This course was recorded using Tableau 9, which is not the latest version. However, all the content within the class applies to Tableau 9.x and higher. Just be aware that your screen may look a little different due to updates in the software. "By offering this course for free, my goal is to help someone navigate through these challenging times with a new skill set or even a career shift. It's worth it not just for you but for the potential impact it could have." ~ Dave, Course Author
Ready to Turn Data into Insight? 📈🔍 Join us on this journey through Tableau and unlock the full potential of your data. Sign up now and embark on a path to becoming a data visualization virtuoso! 🌟🎓
Modules at a Glance:
- Module 1: Getting Started with Tableau
- Module 2: Introduction to Calculations and Functions
- Module 3: Crafting Different Types of Charts
- Module 4: Data Joins and Relationships
- Module 5: Animating Visualizations
- Module 6: Grab Bag Topics
Remember: This course is designed for beginners and novices in Tableau. If you're an experienced user, some of the content may be familiar to you. 🛣️🚀
Dive into "Tableau | A Quick Start Guide Part 2" today and transform your approach to data analysis forever! 🌟
Course Gallery


Loading charts...