Tableau 2022 : A Complete Guide For Beginners In Hindi

Why take this course?
🎓 Course Title: Tableau 2022: A Complete Guide For Beginners in Hindi 🚀
Hear ye, Hear ye! 🌟
Are you ready to embark on a journey into the world of data analytics with Tableau? Whether you're a business analyst, a curious student, or an aspiring data enthusiast, this course is your golden ticket to mastering Tableau from scratch and becoming a pro at uncovering hidden patterns in your data!
Tableau To Analyze And Introspect: 🔍
- Connecting Tableau to datasets: Learn how to seamlessly integrate Tableau with various data sources, turning raw information into actionable insights.
- Connecting to excel, CSV, and other data files
- Understanding different types of connections
- Creating beautiful dashboards: Transform complex datasets into stunning visualizations that tell your data's story with clarity and precision.
- Design principles for impactful dashboards
- Interactive elements to engage your audience
- Visualizing data: Master the art of choosing the right chart type to convey your message effectively and uncover trends and patterns in your data.
- Bar charts, line graphs, pie charts, and more!
Raw Data Transformation Using Tableau 2022: 🛠️
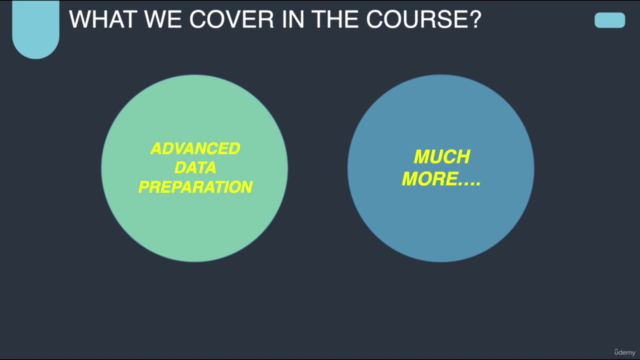
- Data Preparation: Turn raw, unstructured data into a format that's ready for analysis. You'll learn to handle datasets from various sources, including Excel and CSV files.
- Data cleaning and preparation techniques
- Efficient methods for handling large datasets
Stay Updated with the Latest Version: 📚
We ensure that our course content is always up-to-date with the latest version of Tableau, ensuring that you receive the most current and relevant information throughout your learning journey.
Dataset Availability: 💻
Leverage datasets easily accessible on the internet, allowing you to apply the concepts discussed in this course directly to real-world data.
Basic Overview Of The Course: 🧭
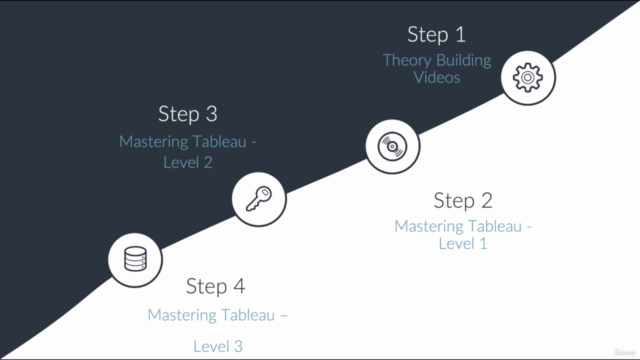
This course is designed as a comprehensive guide for beginners, starting from the very basics of Tableau and gradually moving towards more advanced concepts. By completing this course, you'll be well-equipped to tackle any challenge in your Tableau journey with confidence.
- Understanding Tableau fundamentals: Get comfortable with the interface and core functionalities.
- Overview of data visualization: Learn how to present data effectively to tell compelling stories.
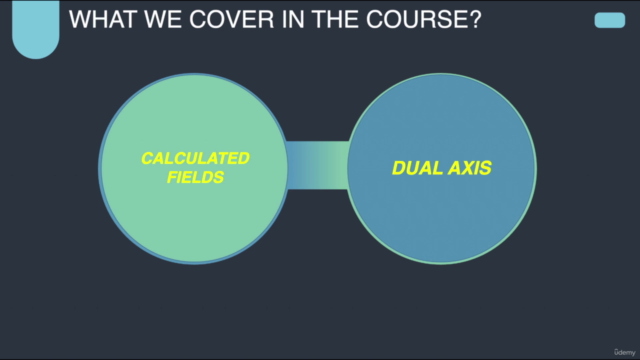
- Advanced concepts: Trend identification, parameter creation, and calculated fields are just a few of the topics you'll master.
Dive into Data Visualization: 📊
- Creating Charts & Dashboards: Begin your journey by creating various chart types, including scatterplots and interactive dashboards tailored to your projects' needs.
- Parameter and Calculated Fields: Learn the process of creating parameters and calculated fields with analogies that make programming concepts easy to understand.
Upon Course Completion: 🏅
You will be a Tableau expert, ready to tackle any analytical challenge with finesse. Your newfound skills will position you as an ideal candidate for a Business Analytics role in top organizations, and you'll approach interviews with the confidence of someone who knows the tools inside out.
Join Us On This Adventure: 🌐
We're excited to have you on board! With this course, you'll not only learn Tableau but also how to think like a data analyst. From connecting datasets to creating captivating visualizations and dashboards, you'll be well-prepared for the world of data analytics.
Wishing you success and looking forward to your transformation into a Tableau maestro! Let's get started 💫📈!
Course Gallery


Loading charts...