Tableau A-Z : Master Tableau for Data Science and BI

Why take this course?
🌟 Unlock the Full Potential of Tableau with Our Comprehensive Course! 🌟
Course Title: Tableau 2021 A-Z: Master Tableau for Data Science and Business Intelligence (BI)
Headline: Dive into the World of Data Visualization & BI with Tableau!
Description:
Are you ready to embark on a journey to master Tableau, one of the most powerful tools in Data Visualization, Business Intelligence, and Data Science? 📊🤖 Our meticulously crafted online course "Tableau 2021 A-Z: Master Tableau for Data Science and BI" is your passport to transforming your data into compelling visual stories!
Why Choose This Course?
This course is designed with a singular goal in mind - to elevate you from a Beginner to an Expert in just 10 hours of focused learning. Covering A-Z of Tableau, we ensure that by the end, you'll have a robust understanding of this tool and its applications in data analytics.
Course Structure:
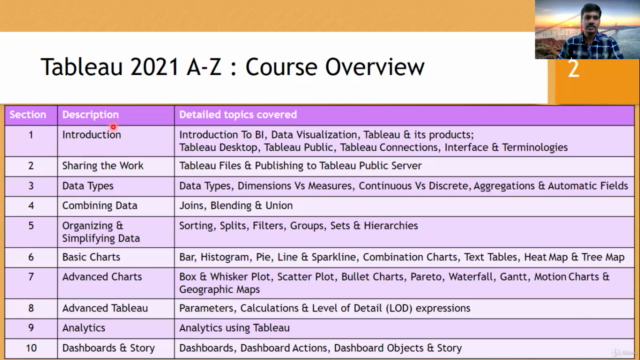
This course is divided into 10 comprehensive sections:
-
Introduction to BI & Tableau: Get familiar with Business Intelligence concepts, the Tableau product suite, establishing connections with various data sources, and understanding the interface and terminologies that form the foundation of your Tableau journey.
-
Sharing Your Work: Learn how to share your Tableau work effectively by publishing it on Tableau Public Server, connecting with a broader community, and showcasing your analysis.
-
Data Types & Measures: Grasp the differences between Dimensions and Measures, understand continuous vs discrete data, explore aggregations, and get acquainted with automatic fields that Tableau generates for you.
-
Combining Data: Master data manipulation techniques such as joins, data blending, and union to enrich your datasets and provide a holistic view of the information.
-
Organizing & Simplifying Data: Discover how to filter, split, sort, group, set, and create hierarchies within your data to simplify complex datasets and focus on what truly matters.
Basic Charts: Dive into creating a variety of charts, including:
- Bar Charts
- Histograms
- Pie Charts
- Line & Sparkline Charts
- Combination Charts
- Text Tables
- Heat Maps
- Tree Maps
Advanced Charts: Explore more complex visualizations such as:
- Box & Whisker Plots
- Scatter Plots
- Bullet Charts
- Pareto Charts
- Waterfall Charts
- Gantt Charts
- Motion Charts
- Geographic Maps
-
Advanced Tableau Topics: Delve into the world of calculations, parameters, and Level of Detail (LOD) expressions to unlock advanced analytical capabilities within Tableau.
-
Analytics with Tableau: Utilize Tableau's analytics features, including trends, forecasting, and instant analytics to glean deeper insights from your data.
-
Creating Dashboards & Story: Learn how to craft interactive dashboards and compelling stories that transform raw data into actionable business intelligence.
Learning Experience:
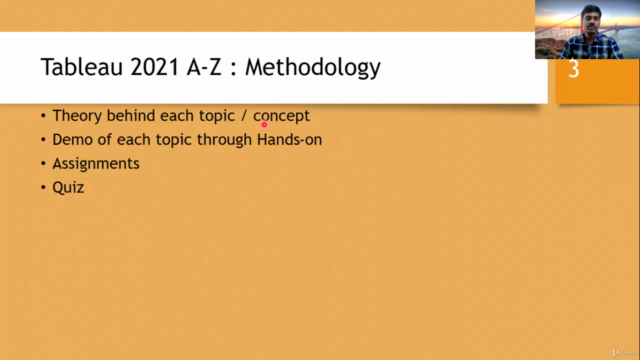
Our course goes beyond just theoretical knowledge - each topic is complemented with a demo to illustrate the concepts in practice. You'll also engage with assignments that allow you to apply what you've learned directly to your data. Finally, to test your understanding and mastery of the material, we provide quizzes at the end of each section.
Whether you're a data scientist, analyst, business professional, or just someone curious about the power of data visualization, this course will equip you with the skills to tell compelling stories through your data. 📈✨
Join us and Happy Learning! Your data awaits, and with Tableau in your toolkit, you're ready to transform it into a story that informs and inspires. Enroll now and start your journey to becoming a Tableau expert today!
Course Gallery


Loading charts...