TABLEAU 2018: Hands-On Tableau Training For Data Science!

Why take this course?
📊 Tableau 2018: Hands-On Tableau Training For Data Science 🚀
Course Headline: 🎓 Learn Tableau for Data Science step-by-step. Real-Life Data Analytics Exercises & Quizzes Included. Learn by doing!
Embark on a Data Visualization Journey with Tableau 2018!
Dive into the world of data analytics and discover patterns, trends, and bottlenecks that can drive your business decisions or inform scientific inquiries. With this comprehensive online course, you'll master all aspects of Tableau to transform raw data into compelling visualizations. 📈
Unlock the Power of Data with Tableau:
-
Connect, Analyze, and Visualize: Learn how to connect Tableau to a myriad of datasets, perform complex analyses, and present your findings in an impactful way.
- Connect Tableau to various data sources
- Perform advanced data manipulations such as blending and joining datasets
- Calculate key metrics with precision
-
Master Data Visualization: Convert raw data into beautiful visualizations that tell a story, using Tableau's powerful features.
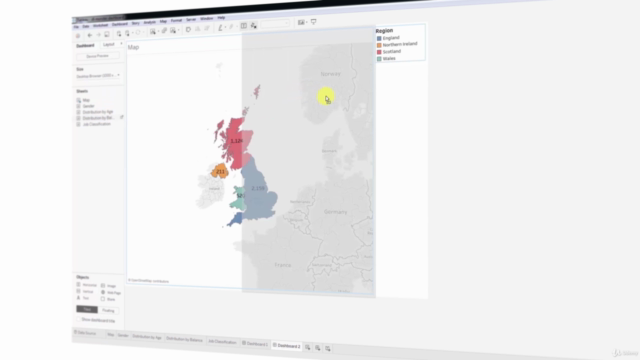
- Create charts, plots, and maps to represent your data
- Develop interactive dashboards to engage users and stakeholders
Course Contents and Overview:
This course is designed to accommodate learners of all levels, from beginners to seasoned professionals. We'll start with the basics to ensure everyone is on the same page before diving into more advanced topics. 🎥
-
Tableau Fundamentals: Navigate the Tableau interface, connect to data files, and export your first worksheet. Get comfortable with the tools as you lay the foundation for advanced data analytics.
-
Trend Analysis & Forecasting: Learn how to use data extracts and timeseries to spot trends and make accurate forecasts. This skill is crucial for data science applications.
-
Data Summarization Techniques: Use aggregations to summarize information, ensuring your data is easy to digest and your calculations are accurate.
-
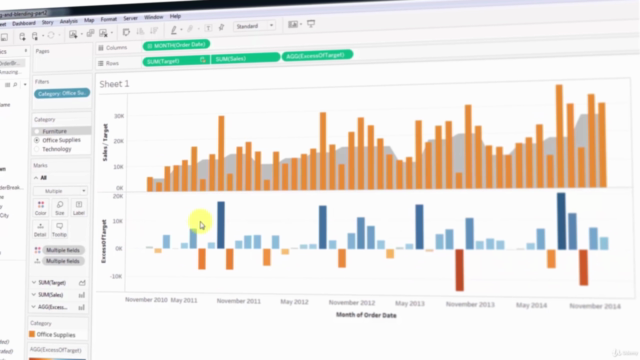
Advanced Data Visualizations: Create a variety of charts, including scatterplots and interactive dashboards, tailored to each project's needs.
-
Data Joining & Blending: Discover when and how to join or blend data from multiple sources to present comprehensive information.
-
Tableau 10 Data Preparation Features: Explore advanced features like table calculations, treemap charts, and storylines to prepare your data for in-depth analysis.
By the end of this course, you will:
- Be a highly proficient Tableau user equipped with the skills to extract knowledge from data.
- Analyze and visualize complex questions with ease as a data scientist.
- Collect, examine, and present data for any purpose, be it scientific research or commercial analysis.
- Stay ahead of the competition by keeping your skills updated with the latest features in Tableau.
Take the first step towards becoming a Tableau data wizard! Enroll now and transform your approach to data analytics. 🌟
Join Kirill Eremenko, an expert instructor, on this journey through data science with Tableau 2018. Let's turn your raw data into actionable insights together!
Course Gallery


Loading charts...
Comidoc Review
Our Verdict
Tableau 2018: Hands-On Training For Data Science offers an engaging and practical learning experience for those new to the data analytics field. However, some areas such as community interaction and exercise provision could see improvements. The course's strong suit lies in its real-life examples, instructor support, and depth of basic knowledge presented. Delving into advanced techniques would further bolster this already impressive foundation.
What We Liked
- Comprehensive coverage of Tableau fundamentals, including various chart types, data blending, and dashboard creation
- Real-life examples throughout the course enrich students' understanding of how Tableau can be applied in data science scenarios
- Active Q&A support for queries and valuable instructor knowledge
- Includes time series analysis with two different methods
Potential Drawbacks
- Lack of practical exercises may require self-learning
- Minor differences in the Tableau Desktop version used between Macs and PCs can cause confusion during lessons
- Could benefit from advanced features introduction and deeper community involvement
- Course structure needs improvement for a smooth learning experience