Statistics for Data Science and Business Analysis
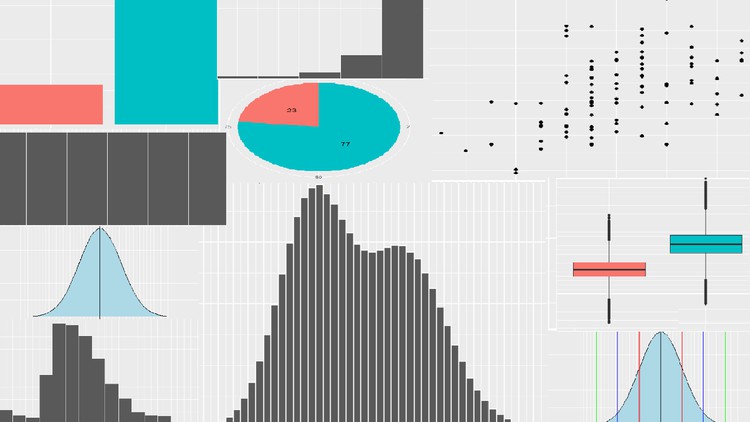
Why take this course?
🌟 Course Title: Statistics for Data Science and Business Analysis
🎓 Headline: Mastering Statistics Fundamentals using R Programming with Saira Sadiq
Course Description:
Are you ready to transform your approach to data analysis? Whether you're a data science enthusiast or a business analyst looking to sharpen your skills, our Statistics for Data Science and Business Analysis course is the perfect springboard to mastering the world of statistics through the lens of R programming.
📚 About the Course: This isn't just another statistics course; it's a deep dive into the core principles of data science and business analysis using R—a language that's both powerful and user-friendly. Led by the expert tutelage of Saira Sadiq, this course is meticulously designed to cater to beginners as well as those looking to elevate their statistical expertise.
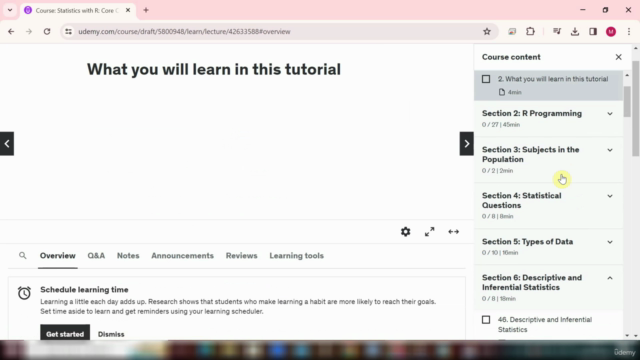
🔍 What You'll Learn:
- R Programming Fundamentals: Get up to speed with the basics of R and understand its role in data analysis.
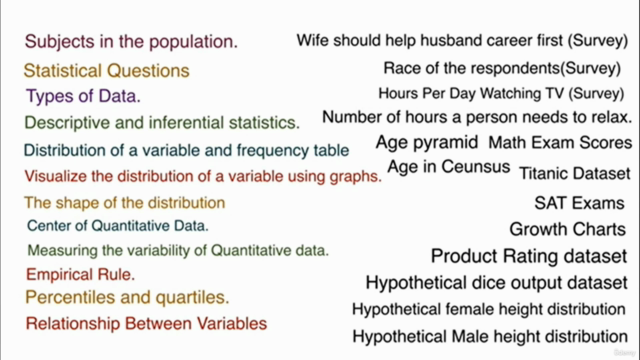
- Population Concepts: Explore the nuances of subjects in the population and how they relate to your data set.
- Statistical Questions: Learn to frame meaningful statistical questions that drive real insights from your data.
- Data Types: Gain proficiency with different types of data, including categorical and quantitative data.
- Descriptive Statistics: Discover the power of describing data using measures of central tendency, variation, and graphical representations.
- Inferential Statistics: Develop your understanding of making inferences about populations from a sample of data.
- Data Visualization: Learn to create compelling visualizations that make complex data easily digestible.
- Distribution Shapes: Understand the implications of different distributions and how they impact analysis.
- Center and Variability Measures: Master calculating the center of quantitative data and measuring its variability.
- The Empirical Rule: Learn about this powerful rule that allows us to make inferences about normal distributions.
- Percentiles, Quartiles, and Beyond: Dive into the world of percentiles and quartiles and learn how they can guide your analysis.
- Relationship Analysis: Uncover the relationships between variables and their significance in data science.
Why Take This Course?
- Real-World Application: Gain practical experience by applying statistical concepts to real-world datasets.
- Hands-On Learning: Engage with interactive modules that solidify your understanding of complex statistical methods.
- Skill Enhancement: Whether you're a beginner or looking to refine your skills, this course will help you achieve mastery in statistics and R programming for data science and business analysis.
🎉 Course Highlights:
- Learn at your own pace with flexible learning materials.
- Access to expert support from Saira Sadiq throughout your learning journey.
- Interactive quizzes to reinforce your understanding of key concepts.
- Real-world case studies that showcase the application of statistics in various industries.
Embark on Your Learning Journey Today! Statistics is a cornerstone of data science and business analysis, and with this course, you'll unlock the door to interpreting data with confidence. Whether you're aiming to pursue a career in data science or looking to enhance your business analysis capabilities, this course will provide you with the analytical tools and insights necessary for success.
Enroll now and join a community of learners who are shaping the future of data-driven decision making! 🚀
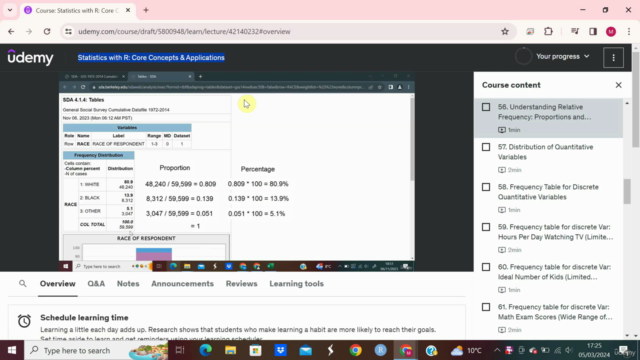
Course Gallery
Loading charts...