Learn By Example: Statistics and Data Science in R
Why take this course?
🚀 Course Headline: 🎓 "Learn By Example: Statistics and Data Science in R" – A Gentle Yet Thorough Introduction with Real Life Applications!
🌍 About the Instructor: 👩🏫 Meet your guide on this learning journey – a Stanford-educated, ex-Googler and an IIT, IIM-educated ex-Flipkart lead analyst. With decades of practical experience in quant trading, analytics, and e-commerce, you're in expert hands!
📚 Course Description: 🔍 This course is designed to be a gentle yet thorough introduction to Data Science, Statistics, and the R programming language. It's perfect for beginners who are interested in starting a career in analytics or data science. We'll begin with foundational concepts and progressively cover more advanced topics. 🧮
🔍 What You Will Learn:
-
Data Analysis with R: Dive into R to handle different datatypes, data structures like Vectors, Arrays, Matrices, Lists, Data Frames, and learn how to read data from files. Master aggregating, sorting, and merging Data Frames to analyze datasets effectively. 📊
-
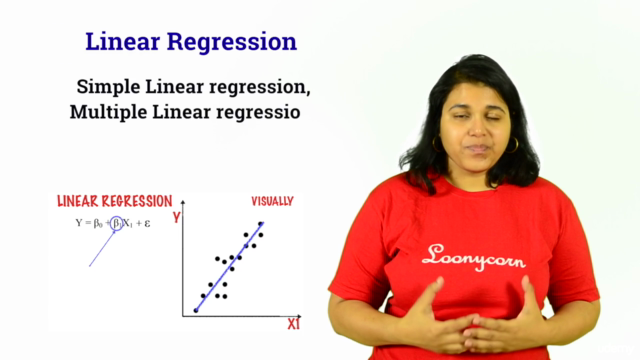
Linear Regression: Understand the basics of linear regression, perform simple linear regression in both Excel and R, delve into multiple linear regression, incorporate categorical variables, explore robust regression techniques, and interpret diagnostic plots. 📈
-
Data Visualization in R: Learn to create a variety of plots including line plots, scatter plots, bar graphs, histograms, scatterplot matrices, and heat maps using powerful R packages like
Rcolorbrewerandggplot2. Visualize your data in ways that make complex data simple to understand. 🎨 -
Descriptive Statistics: Get a grasp of key descriptive measures such as mean, median, mode, IQR, standard deviation, and frequency distributions. Learn how to represent these using histograms and boxplots for effective data summarization. 📊
-
Inferential Statistics: Grasp the concepts of random variables, probability distributions (Uniform & Normal), sampling, and hypothesis testing. Understand test statistics and significance tests to make informed decisions based on data. 🧐
🎉 Key Features:
-
Real Life Examples: Each concept is illustrated with real life examples and case studies, ensuring you can apply what you learn directly to the world of business, finance, or any field that interests you! 🌍
-
Hands-On Practice: Get hands-on experience with source code in R to solidify your understanding of each topic. 👩💻
-
Comprehensive Curriculum: From the basics of data science and statistics to advanced analytics, this course covers it all! 🚀
Enroll now to embark on a transformative learning journey in Data Science and Statistics using R. Transform your career by turning data into actionable insights with confidence! 🌟
Course Gallery
Loading charts...